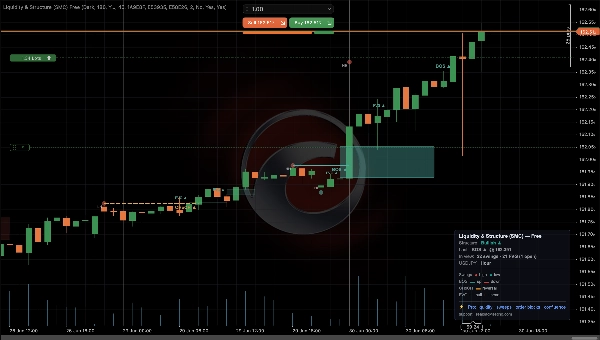

Penerangan
Dokumentasi penuh, setiap tetapan dan semua data dengan lebih terperinci di laman web kami: realbacktesting.com
Kecairan & Struktur (SMC) (Percuma) — Konsep Wang Pintar pada carta cTrader anda. Tiada cat semula, dan ia mengukur dirinya sendiri.
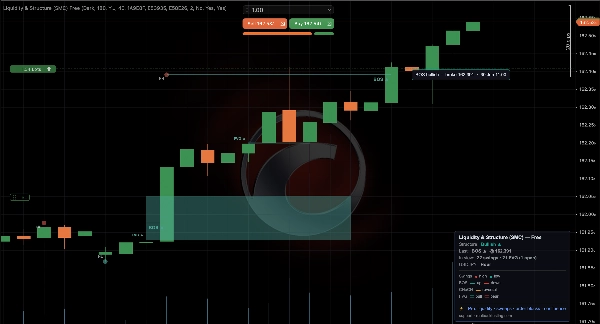
Baca Wang Pintar. Penunjuk percuma ini melukis keseluruhan gambaran teras SMC — struktur, jurang, blok pesanan, kecairan dan premium/diskaun — dalam satu lapisan bersih yang tidak pernah cat semula. Dan kemudian ia melakukan sesuatu yang tiada penunjuk lain dalam kategori ini lakukan: ia mengira, pada bar ANDA, berapa kerap harga benar-benar bertindak balas di zon yang dilukisnya.
APA YANG ANDA DAPAT (PERCUMA)
✅ Struktur pasaran — BOS / CHoCH, dilabel secara automatik, dengan HH / HL / LH / LL
✅ Jurang nilai adil (FVG) — dilukis, keadaan terisi dikesan, dengan penapis saiz minimum
✅ Blok pesanan — zon bullish / bearish, dengan penapis perpindahan dan kualiti badan
✅ Kecairan — tinggi / rendah yang sama dan sapuan pemburuan hentian
✅ Premium / diskaun — di mana harga berada dalam julat ayunan semasa
✅ Kebolehpercayaan yang diukur — kadar kejayaan zon yang dilukis, pada carta anda sendiri
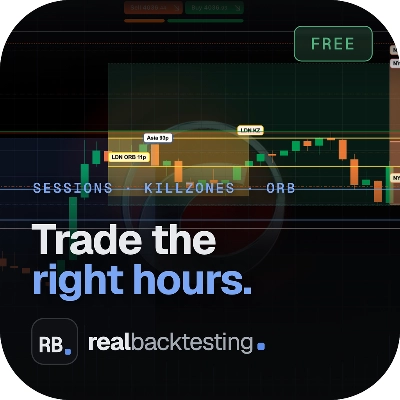
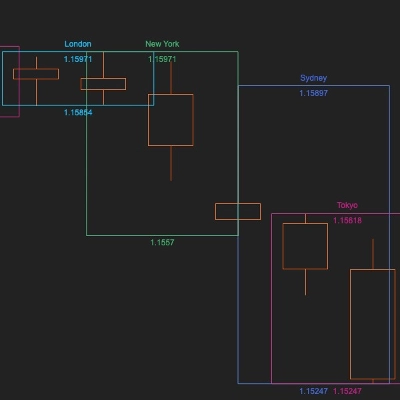
✅ Sesi pada jam pasaran masing-masing — peralihan musim panas diterapkan untuk anda
✅ Tiada cat semula — setiap elemen datang dari lilin yang ditutup
✅ Warna, lebar, kelegapan dan elemen yang dilukis boleh dikonfigurasikan
DIUKUR, BUKAN DIJANJIKAN
Panel mencetak sesuatu seperti "Blok pesanan bertahan 65% (n=258)". Itu adalah simbol anda, jangka masa anda, ambang anda — dikira pada bar anda, boleh diulang oleh anda. Ia adalah kiraan tindak balas harga pada lilin yang ditutup, bukan hasil strategi: tiada kemasukan, tiada hentian, tiada kos. Kami lebih suka menunjukkan nombor yang anda boleh periksa daripada tuntutan yang anda perlu percayai.
⭐ TINGKATKAN KE PRO ($29, sekali sahaja) — apa yang sebenarnya ditambah:
▸ Pecahan sesi penuh — tiga sesi, tetingkap anda sendiri, dan jam setiap satu dibaca
▸ Kalibrasi automatik — ia menyapu 12 tetapan dan melaporkan yang terbaik untuk simbol ANDA, bersebelahan median sapuan
▸ Perbandingan kemasukan FVG — masuk di tepi jurang berbanding menunggu 50%-nya
▸ Lewat sentuhan — berapa lama satu tahap mengambil masa untuk terkena, supaya anda tahu bila untuk melepaskannya
▸ Penapis kualiti yang menyembunyikan blok pesanan di bawah kadar kejayaan yang diukur
▸ MSS, FVG songsang, struktur pelbagai jangka masa, skor konfluens 0–100 dan amaran e-mel / Telegram
== APA YANG AKAN DATANG ==
Penunjuk ini menunjukkan kepada anda DI MANA, dan kini ia juga memberitahu anda berapa kerap DI MANA itu bertahan pada carta anda sendiri. Ia tidak menetapkan saiz, hentian atau duduk keluar untuk anda.
Itulah separuh lagi, dan itulah yang diotomatikkan oleh cBots portfolio kami — enjin yang sama, kesetaraan Python/C# yang disahkan, keputusan dipantau secara langsung oleh cTrader:
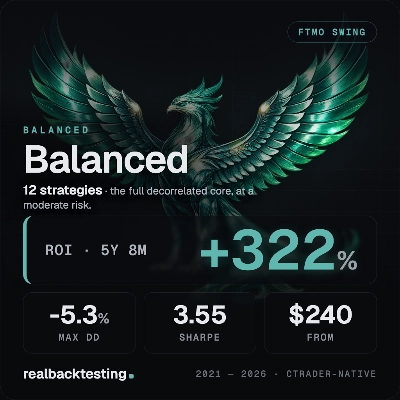
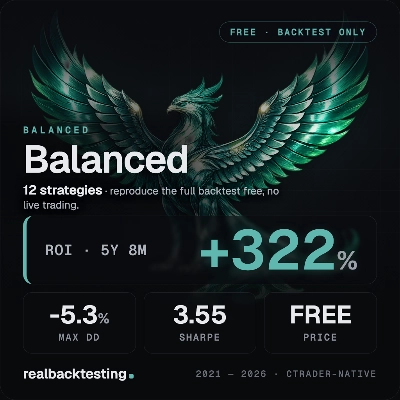
👉 Balanced FTMO Swing, edisi percuma, uji semula pada kos anda sendiri: ctrader.com/products/4615
CARA MENGGUNAKAN
1. Tambah ke cTrader → carta → Penunjuk → "Liquidity & Structure (SMC)".
2. Beri beberapa saat: ia memuat sejarah supaya pengukuran lengkap. "perlu 20+" bermaksud bar hilang, bukan ada yang rosak.
3. Pilih elemen mana yang hendak dilukis. Tetapan lalai adalah bersih dan setiap parameter menerangkan dirinya sendiri dalam panel.
4. Ia memetakan carta secara langsung dan tidak pernah cat semula.
⚠️ SMC adalah rangka kerja, bukan jaminan. Ini melukis peta dengan bersih dan memberitahu anda dengan jujur berapa kerap ia bertahan. Ia tidak menjanjikan kadar kemenangan.
Ringkasan
Ulasan pelanggan
5 | 100 % | |
4 | 0 % | |
3 | 0 % | |
2 | 0 % | |
1 | 0 % |