present
Registrieren Sie sich und erhalten Sie $50 Rabatt auf Ihren ersten Kauf
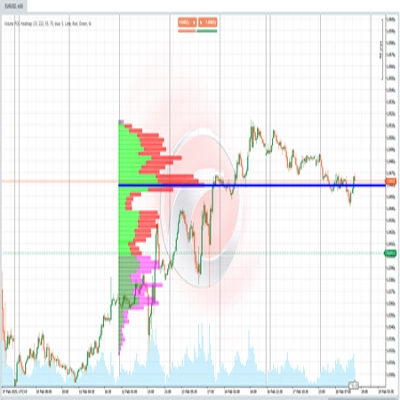
Trading product for NexoStructureAtlas Indikator Key Levels MSS, image 1
NexoStructureAtlas
Indikator
Version 1.0, Oct 2026
Windows, Mac
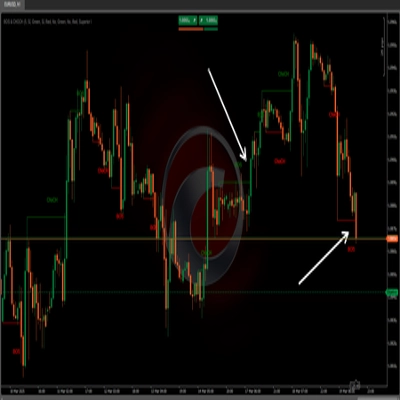
Trading product for NexoStructureAtlas Indikator Key Levels MSS, image 2
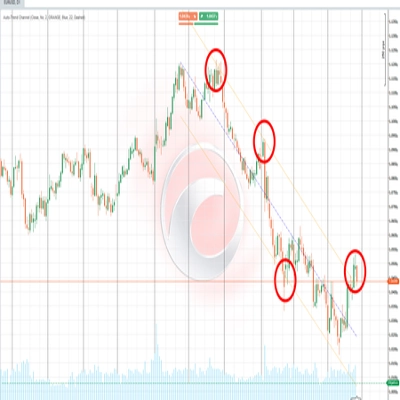
Trading product for NexoStructureAtlas Indikator Key Levels MSS, image 3
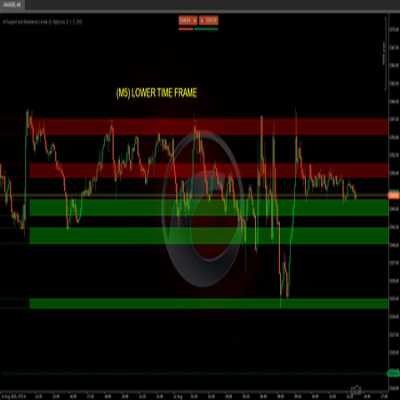
Trading product for NexoStructureAtlas Indikator Key Levels MSS, image 4
Trading product for NexoStructureAtlas Indikator Key Levels MSS, image 5
Seit 03/10/2024
177
Verkäufe
45.22K
Kostenlose Installationen

Beschreibung

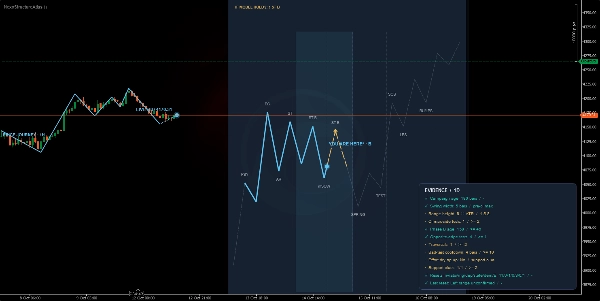
Nexo Structure Atlas ist ein professionelles technisches Analysewerkzeug, das für Trader entwickelt wurde, die auf Marktstruktur und institutionelle Zyklusdynamiken basieren. Der Indikator automatisiert die Identifikation von Bereichen, Strukturphasen und wichtigen Wendepunkten und projiziert intuitive visuelle Hilfsmittel direkt auf das Chart.

📊 Analysierte Marktdaten und -bedingungen

https://chartshots.spotware.com/c/6acd2589646ae

Der Indikator verarbeitet die Kursbewegungen sowohl im aktuellen Chart als auch in höheren Zeitrahmen. Er analysiert:

  • Preisbereiche, ATR-Amplituden und Schwungweiten (Pivots).
  • Entwicklung und Übergang von Akkumulations-, Distributions-, Reakkumulations- und Redistributionsphasen.
  • Stop-Aktionen, abschließende Tests und institutionelle Unterstützungs-/Widerstands-Liquiditätsniveaus.

https://chartshots.spotware.com/c/6acd25cee9110

👁️ Wie man visuelle Elemente und Signale interpretiert

https://chartshots.spotware.com/c/6acd260deee0e

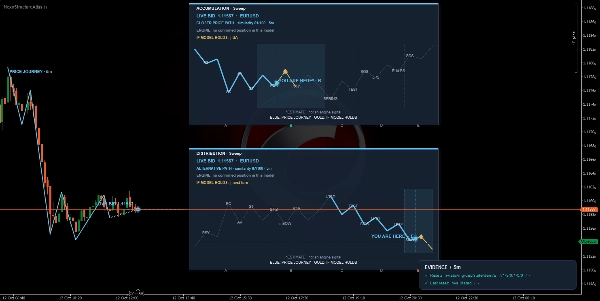
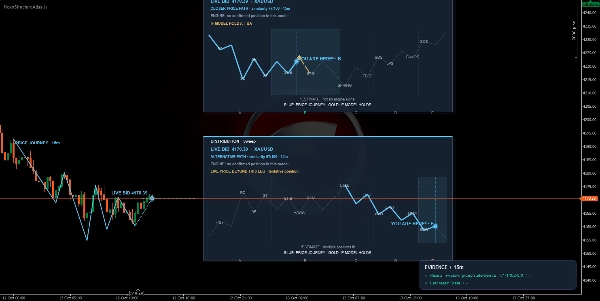
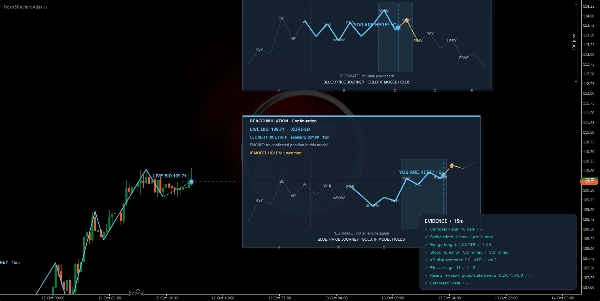
  • Referenzkarten: Optionale überlappende Panels, die ideale Schemata des aktuellen Zyklus zeigen (z. B. Sweep- oder Akkumulations-/Distributionsmodelle), sodass Sie visuell vergleichen können, wo sich der Preis innerhalb des theoretischen Modells befindet.
  • Preisverlaufsspuren: Zeichnet bedeutende Kursbewegungen und Schwünge im Chart, um die Trendstruktur und Charakteränderungen klar zu visualisieren.
  • Einstiegsabzeichen: Visuelle Markierungen im Chart, die potenzielle Chancen mit hoher Wahrscheinlichkeit an wichtigen Strukturpunkten signalisieren (wie Phasentests, Unterstützungs-/Widerstandstests und Trendbestätigungen) gemäß der konfigurierten Filterpolitik.
  • Beweis- und Zusammenfassungs-Dashboard: Ein diskretes Informationspanel, das kritische Kennzahlen der aktuellen Kampagne detailliert darstellt: Phasenalter, Bereichshöhe in ATR, Validierungsstatus und Unterstützungsmetriken.

⚙️ Wichtige Einstellungen und Parameter

https://chartshots.spotware.com/c/6acd26ad835f3

Der Indikator bietet umfangreiche Anpassungsmöglichkeiten, die in Gruppen unterteilt sind und von cTrader aus zugänglich sind:

  • Referenzatlas: Modellauswahl (automatisch oder manuell), Anzahl sichtbarer Referenzkarten, horizontaler Versatz und Typografiegröße.
  • Struktur und Historie: Aktivierung von Live-Pfaden, historische Analyse höherer Zeitrahmen und Filterung nach Mindestphasen.
  • Signale und Kontext: Einstiegsqualifikationsrichtlinien (Konservativ, Standard, Aggressiv) und Auswahl zusätzlicher Einstiegsauslöser.
  • Dashboard und visuelle Identität: Vollständige Farbanpassung (Jadetöne für Nachfrage, Koralle für Angebot, Oberflächen- und Textfarben), Bereichsopazitäten, Linienstärken und Soundalarme für bestätigte Einstiege.

🎯 Anwendungsfälle und Handelsszenarien

  • Institutionelle Bereichserkennung: Ideal zum Erkennen, wann ein Asset Ursache (Akkumulation/Reakkumulation) oder Wirkung (Distribution/Redistribution) aufbaut.
  • Wendepunkt-Handel: Verwendung von Einstiegsabzeichen und Phasentests, um Positionseinstiege zu suchen, die die Hauptstrukturbewegung mit definiertem Risikomanagement begünstigen.

⚠️ Wichtige Einschränkungen und Nutzungshinweise

  • Der Indikator erfordert zeitbasierte Charts (Minuten, Stunden, Tage, Wochen oder Monate).
  • Es handelt sich um ein fortgeschrittenes technisches Analyse- und Entscheidungshilfetool; es stellt keine automatisierte Finanzberatung dar und garantiert nicht eigenständig Gewinne. Eine ordnungsgemäße Risikoverwaltung und Validierung mit der eigenen Handelsstrategie werden empfohlen.

Zusammenfassung

Indikatorprofil
Indikatorkategorie
Marktstruktur (SMC)
Ausgabetyp
Visualisierung
Signale
Datenanforderungen
Nur Balken
Unterstützte Signale
Ausbruch
Wendepunkt
Level – Berührung
Level – Durchbrechen

Kundenbewertungen

0.0
Bewertungen: 0
Kundenbewertungen
Bisher gibt es keine Bewertungen für dieses Produkt. Haben Sie es schon ausprobiert? Dann können Sie die erste Person sein, die andere darüber informiert!

Diskussion

Häufig gestellte Fragen (FAQ)

Key Levels
MSS
CHOCH
Market Structure
ATR
Liquidity Grab
Support & Resistance
Über den cTrader Store verfügbare Produkte, einschließlich Handelsbots, Indikatoren und Plugins, werden von externen Entwicklern bereitgestellt und nur zu Informations- und technischen Zugriffszwecken verfügbar gemacht. cTrader Store ist kein Broker und erbringt keine Anlageberatung, persönlichen Empfehlungen oder eine Garantie für zukünftige Performance.

Mehr von diesem Autor

Indikator
ATR
RSI
+7
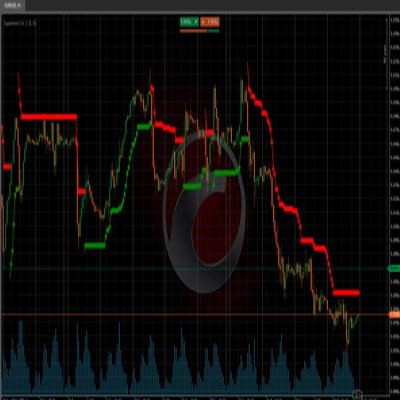
ZigZag filters noise, spots trends, patterns, pivots, aiding analysis, trade management, and confirmations. 📉📈
Indikator
ATR
RSI
+7
Identify bullish and bearish Order Blocks to spot key support/resistance levels and potential trend reversals! 📈🔄
Indikator
ATR
RSI
+7
📊 Shows volume by price levels, highlights POC, and key zones. Identifies dynamic support/resistance and imbalances.
Indikator
ATR
RSI
+6
Market structural patterns , specifically the concepts of Change of Character (ChoCH) 🔄 and Break of Structure (BoS) 💥
Indikator
ATR
RSI
+6
Adaptive trend channel using linear regression and Pearson correlation for dynamic support, resistance, and trends.
Indikator
RSI
Breakout
+1
"Identify key market zones and visualize support/resistance from multiple timeframes on a single chart.
Multi-Plattform-Plugin
Economic Calendar
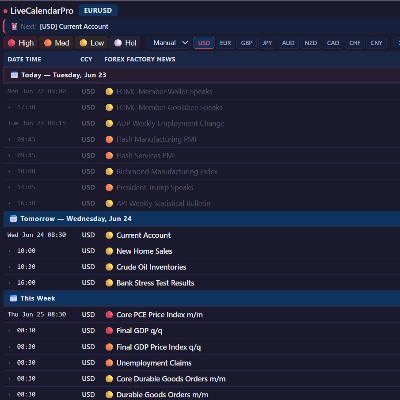
Displays live economic events directly inside your cTrader charts.
Indikator
ATR
RSI
+6
💹 Define a price channel 📈 and determine trend direction (bullish 🟢 or bearish 🔴).
Indikator
ATR
RSI
+7
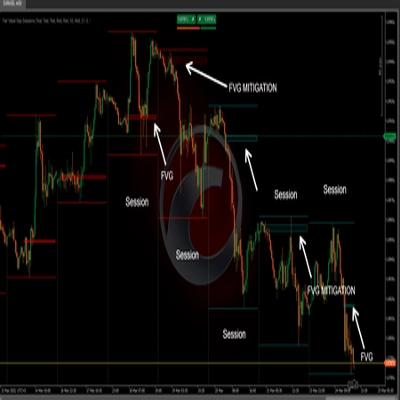
identify and highlight temporary market inefficiencies known as "fair value gaps" 🚨 within specific trading Sessions.
Indikator
RSI
BTCUSD
+5
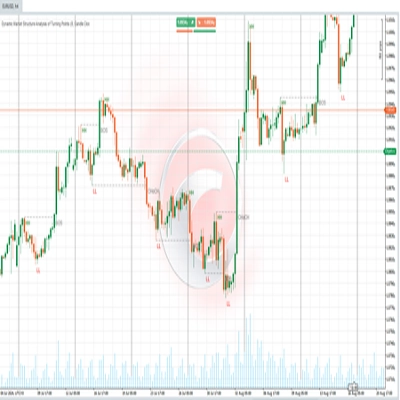
Identify market structure effortlessly with swing highs, lows, CHoCH, and BOS levels for smart trading decisions! 📊🔍"
Indikator
ATR
RSI
+6
📊Zones Supply & Demand: Identifies key price levels with high volume concentration, marking Supply/Demand Zones & Marke
Indikator
Advanced price action tool that combines multiple technical analysis concepts

Das könnte Sie auch noch interessieren

Indikator
MACD
Crypto
A simple tool to control market sessions. fixed the display on the weekend.
Indikator
XAUUSD
Professional Volume Profile Indicator - Shows volume distribution, POC, Value Areas & Buy/Sell pressure.
„KANDIKA HEAT MAP“-Logo
Beste Ratings
4.6
(5)
$19
Indikator
Color-Based Market Pressure & Volatility Visualizer The Kandika Heatmap Indicator
Indikator
ADX
ATR
+2
GOLD SENTINEL v1.0 - A CANDLE-COLORING INDICATOR FOR GOLD.
Indikator
ATR
RSI
+14
A metric that can set 1 to 3 groups of Bollinger Bands
Indikator
Key Levels
Spots key hourly ranges and signals breakouts using arrows & colored background zones. Ideal for Gold.
Indikator
This indicator can be used to: change color, shape size, position, change font, increase or decrease, and other function
Indikator
ATR
MACD
+15
MACD Advanced -- It combines the standard MACD logic with a rich set of visual tools
Indikator
Imbalance
Fair Value Gap
+1
Multi-symbol, multi-timeframe Fair Value Gaps in one panel.
Indikator
Shows BUY & SELL signals for 3 & 4 BAR PATTERN (Morning star/ Evening star). It is adjustable and it will SHOW ARROWS.
Indikator
ATR
Wedge
+2
Strong Supertrend Turn Market Movement into a Clear Map Market analysis
Indikator
AI
ATR
+27
VolumeProfileSuite is an advanced and flexible Volume Profile indicator for cTrader.
Indikator
ATR
RSI
+1
Super Trend Rsi ,ATR + trend change distance + dynamic Alpha, divergence/convergence
Indikator
ATR
RSI
+11
This indicator puts three helpful trading tools on your chart at once. Think of it like having three expert traders
Indikator
Crypto
EURUSD
+5
MultiTimeframe MA
Indikator
Volume
Key Levels
+5
Volume Profile Pro v2 - A Lightweight and Highly Customizable Side & Range Volume Profile
Indikator
VWAP
Volume
+5
Multi VWAP. Three timeframes. One clean chart. Your Essential Trading Tool.
Indikator
AI
ATR
+27
Smart Money Gaps: MTF FVG auto-detection, extension, and mitigation marker. Trade institutional imbalances.

Preis

Seit 03/10/2024
177
Verkäufe
45.22K
Kostenlose Installationen