OR Session Zones
Indicatore
Versione 1.1, Dec 2025
Windows, Mac
4.5
Recensioni: 2
Descrizione
OR Session Zones — Indicatore Multi-Sessione dell'Opening Range
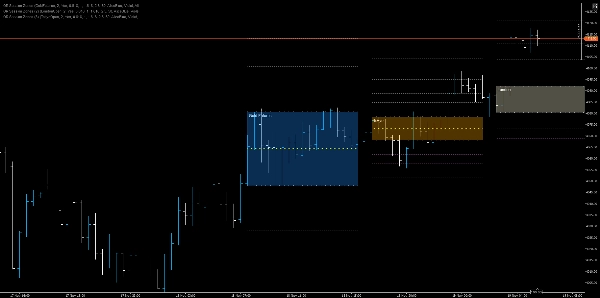
Un indicatore dell'Opening Range ad alta precisione che rileva le aperture di sessione (NY, Londra, UE, Tokyo, Shanghai, futures su Oro/Crude), disegna zone dinamiche OR high/low/mid, proietta obiettivi basati su Fibonacci e dipinge un'area ombreggiata configurabile per decisioni visive rapide.
Caratteristiche principali
- Rilevamento multi-sessione: Supporto nativo per le barre di apertura di New York, Londra, EuroNext, Tokyo, Shanghai, Gold Futures e Crude Futures tramite indicatori di sessione dedicati.
- Calcolo dell'Opening Range: Calcola OR High e OR Low da un numero configurabile di candele (RangeCandles) e registra l'ora di inizio della sessione.
- Sovrapposizioni persistenti sul grafico: Disegna linee di tendenza per OR High, OR Low e OR Mid (50%) su tutto il grafico fino a un tempo di estensione configurabile.
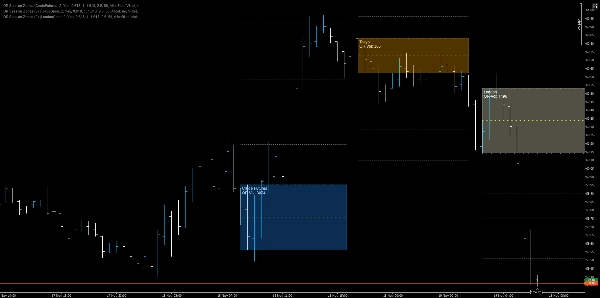
- Zona ombreggiata: Rettangolo riempito tra OR High e OR Low con opacità e colore configurabili per sessione per un contesto visivo immediato.
- Proiezioni di Fibonacci: Fino a quattro linee di proiezione R (resistenza) e S (supporto) derivate dall'intervallo OR con colori indipendenti e opacità regolabile.
- Visibilità flessibile: Opzione per nascondere o rendere ID oggetti indicizzati (unici) per evitare collisioni; supporta sia oggetti persistenti singoli sia oggetti per barra quando Hide è attivato.
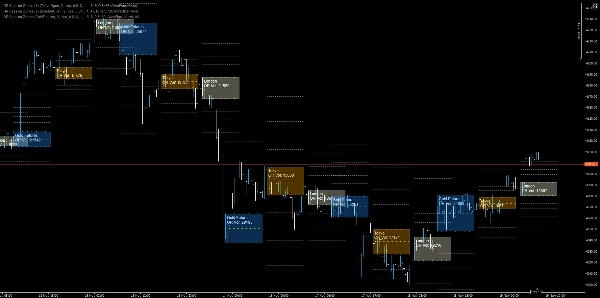
- Codifica colore della sessione: Ogni sessione utilizza uno schema di colori distinto (es. DodgerBlue, LightYellow, Orange, OrangeRed) per rendere immediatamente evidente l'origine della sessione.
Come aiuta i trader
- Contesto rapido: Vedi immediatamente dove il mercato ha aperto per una sessione importante e comprendi la struttura iniziale del range senza misurazioni manuali.
- Trigger decisionali: Usa rotture OR, rifiuti della linea mediana e proiezioni di Fibonacci come regole di ingresso/uscita o ancore per il posizionamento degli stop.
- Strategia multi-sessione: Combina OR sovrapposti (es. Londra + NY) per rilevare zone di confluenza di sessione e aree di trading a probabilità più alta.
- Gestione del rischio: Posiziona stop dietro pile di OR o usa il 50% mediano come obiettivi dinamici di stop/take.
Scenari d'uso e regole di esempio
- Entrata breakout: Compra alla chiusura sopra OR High con conferma da volume o momentum; stop appena sotto OR High (o OR Mid per uscite più strette).
- Fade dell'apertura: Vendi vicino a OR High con conferma di inversione se il prezzo non riesce a mantenersi sopra OR Mid e mostra un rapido ritiro degli ordini di acquisto.
- Trade di confluenza di sessione: Quando gli OR di Londra e NY si sovrappongono, considera la sovrapposizione come una zona di domanda/offerta ad alta affidabilità e scala la dimensione della posizione di conseguenza.
- Obiettivi di proiezione: Usa R1/R2/R3/R4 come livelli di take-profit scalati e S1 - S4 simmetricamente per obiettivi al ribasso.
Riepilogo
Profilo indicatore
Recensioni dei clienti
4.5
Recensioni: 2
5 | 50 % | |
4 | 50 % | |
3 | 0 % | |
2 | 0 % | |
1 | 0 % |
Recensioni dei clienti
November 22, 2025
Solid enough as a backup opinion, and It can look better than it is during a lucky run.
November 19, 2025
Discussioni
Domande frequenti
Fibonacci
Forex
Breakout
Indices
EURUSD
Commodities
GBPUSD
XAUUSD
NAS100
I prodotti disponibili tramite cTrader Store, inclusi bot di trading, indicatori e plugin, sono forniti da sviluppatori terzi e resi disponibili esclusivamente a scopo informativo e di accesso tecnico. cTrader Store non è un broker e non fornisce consulenze in materia di investimento, raccomandazioni individualizzate o garanzie di risultati futuri.


Prezzo
26
Vendite
2.15K
Installazioni gratuite