Descrizione
Media Mobile Tillson T3 (Smussatore Adattivo)
Panoramica:
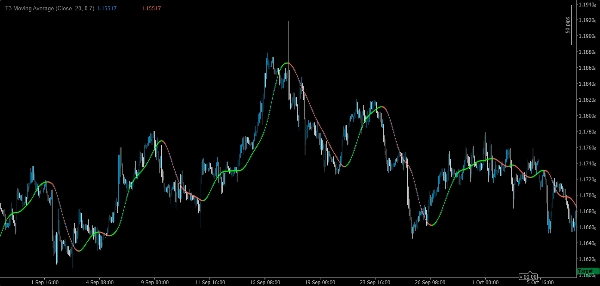
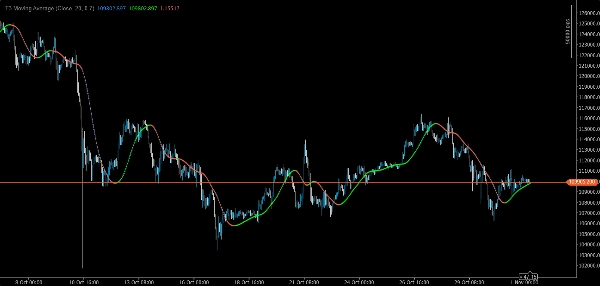
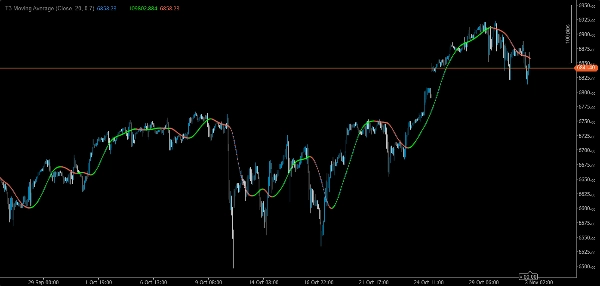
La Tillson T3 è una media mobile di nuova generazione progettata per offrire una fluidità eccezionale con un ritardo minimo. A differenza delle SMA o EMA tradizionali, la T3 applica una cascata di medie esponenziali combinate con un fattore di volume regolabile, offrendo ai trader una linea sia fluida che reattiva. Questo la rende ideale per identificare le tendenze, filtrare il rumore e smussare altri indicatori.
Caratteristiche Principali:
• ⚡ Ritardo Ridotto: Reagisce più rapidamente ai cambiamenti di prezzo rispetto a SMA/EMA evitando però i falsi segnali.
• 🎯 Curva Ultra-Fluidificata: Filtra il rumore di mercato, rendendo più chiara la direzione della tendenza.
• 🔧 Fattore di Volume Personalizzabile: Regola la reattività rispetto alla fluidità (0,3–0,9).
• 📊 Chiarezza Visiva: Fasi di salita e discesa evidenziate con punti colorati.
• 🔄 Casi d'Uso Versatili: Applicabile come filtro di tendenza autonomo, base per trailing stop o smussatore per oscillatori come RSI/MACD.
• 🛠️ Ottimizzato per cTrader: Leggero, non ridipinge e compatibile con più timeframe.
Perché Scegliere Questo Indicatore?
La T3 è ampiamente considerata una delle tecniche di smussamento più efficaci nell'analisi tecnica. Aiuta i trader a rimanere più a lungo in tendenze profittevoli, evitare falsi segnali in mercati agitati e adattarsi a diversi stili di trading. Che tu sia uno scalper, un trader swing o uno sviluppatore di sistemi, la T3 offre un vantaggio affidabile.
Ideale Per:
• Trader che cercano un filtro di tendenza a basso ritardo
• Sviluppatori che necessitano di uno smussatore modulare per strategie personalizzate
• Chiunque desideri un indicatore di livello professionale che superi le medie standard
Riepilogo
Key features include faster reaction to price changes while minimizing false signals, visual clarity through color-coded points indicating rising and falling phases, and versatile applications such as standalone trend filtering, baseline for trailing stops, or smoothing other oscillators like RSI and MACD. The indicator is optimized for the cTrader platform, ensuring lightweight performance, non-repainting behavior, and compatibility across multiple timeframes.
The T3 Moving Average supports a wide range of markets including forex pairs (EURUSD, GBPUSD), cryptocurrencies (BTCUSD), indices (NAS100, US 500), commodities (XAUUSD), and stocks. It is suitable for various trading styles, from scalping to swing trading, and for developers seeking a modular smoother for custom strategies.


![Logo di "Gaussian Channel [Iridio Capital]"](https://cdn.ctrader.com/image/webp/7c039209-5573-4a54-a072-f9528b503103_41960)