
Penerangan
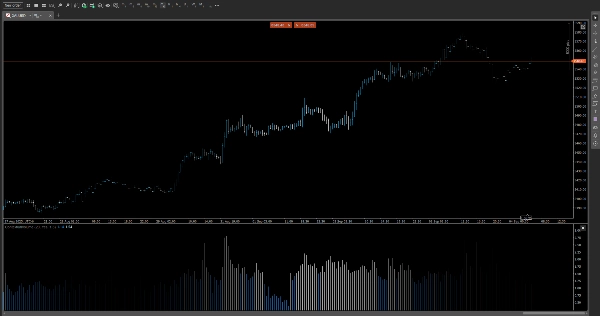
📊 Isipadu Relatif Intrahari (RVI)
Kenal pasti lonjakan isipadu yang penting—apabila ia penting.
RVI adalah penunjuk yang direka dengan tepat yang membandingkan isipadu semasa dengan purata sejarahnya untuk masa yang sama dalam sehari, mendedahkan momentum tersembunyi dan perubahan kecairan sepanjang sesi intrahari.
🔍 Ciri Utama
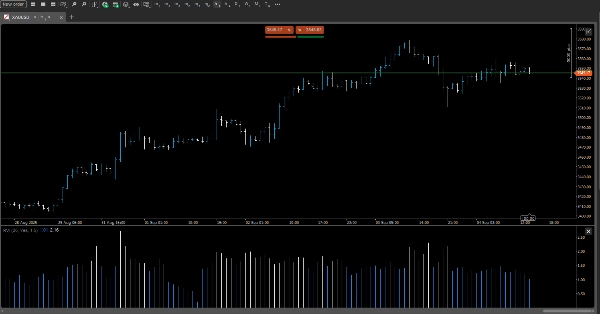
• Profil Isipadu Masa-Hari
Mengira purata isipadu setiap slot masa (contohnya, 10:15 pagi) merentasi sesi sebelumnya, memberikan anda penanda aras kontekstual untuk setiap lilin.
• Sokongan Pelbagai Jangka Masa
Berfungsi lancar dari graf 5-minit hingga jangka masa 12-jam, menyesuaikan dengan gaya dagangan anda—scalping, swing, atau berasaskan sesi.
• Pengekodan Warna Dinamik
Menonjolkan lilin dengan isipadu melebihi purata menggunakan ambang warna yang boleh disesuaikan. Segera kenal pasti zon aktiviti tinggi dengan petunjuk visual yang intuitif.
• Mod Nisbah vs. Perbezaan
Pilih metrik pilihan anda:
• Mod Nisbah: Memaparkan isipadu semasa ÷ isipadu purata (contohnya, 2.3×)
• Mod Perbezaan: Memaparkan penyimpangan mutlak (contohnya, +1,200 kontrak)
• Paparan Lapisan atau Panel
Beralih antara lapisan carta sebaris atau panel sisi padat untuk integrasi bersih dengan susun atur sedia ada anda.
🎯 Kes Penggunaan
• Sahkan kekuatan pecahan dengan lonjakan isipadu berbanding aktiviti biasa
• Tapis isyarat palsu semasa tempoh isipadu rendah
• Kenal pasti jejak institusi semasa tingkap intrahari utama
• Tingkatkan strategi berasaskan isipadu dengan konteks masa yang sedar
⚙️ Pilihan Penyesuaian
• Tempoh semakan semula yang boleh laras untuk purata sejarah
• Ambang warna yang ditentukan pengguna untuk intensiti isipadu
• Togol mod paparan (Nisbah/Perbezaan)
• Serasi dengan tema gelap/terang
Ringkasan
Ulasan pelanggan
5 | 100 % | |
4 | 0 % | |
3 | 0 % | |
2 | 0 % | |
1 | 0 % |


