
KaufmanEfficiencyRatio
Indikator
78 unduhan
Versi 1.0, Sep 2025
Windows, Mac
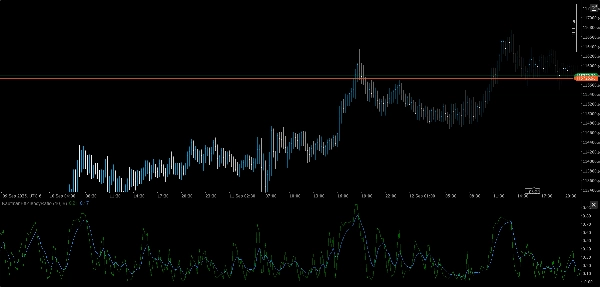
⚡ Rasio Efisiensi Kaufman (KER)
Kejelasan tren, terukur.
Rasio Efisiensi Kaufman (KER) adalah alat presisi untuk mengukur seberapa efisien harga bergerak dari titik A ke B—tanpa tersesat dalam kebisingan. Apakah Anda memvalidasi kondisi breakout atau menyaring pergerakan sideways, KER memberikan skor bersih antara 0 dan 1 yang mencerminkan niat arah dibandingkan volatilitas.
🔍 Apa Fungsinya
- Menghitung Rasio Efisiensi Kaufman:
- Menghasilkan nilai ternormalisasi dari 0 (kebisingan murni) hingga 1 (tren sempurna)
- Menyoroti rezim tren vs. non-tren tanpa ambiguitas
- Ideal untuk overlay adaptif, filter rezim, dan pengaturan sinyal
🛠️ Fitur Utama
- Manajer input modular untuk sumber multi-timeframe
- Kompatibel lintas aset: FX, kripto, indeks, saham
- Logika ringan, real-time tanpa lag pelunakan
- Plug-and-play dengan arsitektur suite Anda yang sudah ada
🎯 Kasus Penggunaan
- Validasi Tren: Konfirmasi bias arah sebelum eksekusi sinyal
- Penyaringan Kebisingan: Menekan entri selama aksi harga yang tidak efisien
- Deteksi Rezim: Pasangkan dengan overlay yang sadar volatilitas untuk transisi yang lebih cerdas
- Pembuatan Strategi: Gunakan sebagai metrik inti dalam logika breakout, momentum, atau bias
💡 Bonus
KER gratis, cepat, dan sangat efisien—seperti kode Anda. Tanpa basa-basi, tanpa filter. Hanya niat pasar murni, yang disaring.
Profil indikator
0.0
Ulasan: 0
Ulasan pelanggan
Belum ada ulasan untuk produk ini. Sudah mencobanya? Jadilah pemberi ulasan pertama!
Breakout
Scalping
AI
Produk-produk yang tersedia melalui cTrader Store, termasuk bot trading, indikator, dan plugin, disediakan oleh pengembang pihak ketiga serta hanya ditujukan untuk akses teknis dan informasi. cTrader Store bukan broker dan tidak menyediakan saran investasi, rekomendasi pribadi, atau jaminan apa pun tentang kinerja di masa mendatang.


25
Penjualan
2.1K
Instal gratis