Descrizione
Harmonic Strategy Suite Pro
La maggior parte degli indicatori armonici disegna un modello e ti lascia indovinare se vale
la pena di fare trading. Questo risponde a quella domanda: ogni modello che trova viene
riprodotto contro la storia stessa del grafico, così puoi vedere il vero tasso di successo di ogni
tipo di modello sullo strumento e timeframe davanti a te - prima di rischiare
qualcosa.
Cosa analizza
L'indicatore lavora esclusivamente dalla struttura dei prezzi - nessun indicatore sovrapposto
ad altri indicatori, nessuna ridipintura di modelli confermati.
Un motore pivot originale spazza il grafico su un'intera gamma di profondità di swing
tutto in una volta, così cattura strutture a diverse scale invece che solo quella
che le tue impostazioni tendono a favorire. I pivot consecutivi nella stessa direzione sono uniti al
vero estremo, dando una sequenza alternata pulita alto-basso-alto.
Ogni finestra consecutiva di cinque pivot (X-A-B-C-D) viene poi misurata rispetto alle
definizioni Fibonacci pubblicate di sei classici modelli armonici:
Gartley B a 0.618 di XA, D a 0.786
Bat B a 0.382-0.50, D a 0.886
Butterfly B a 0.786, D a 1.272-1.618
Crab B a 0.382-0.618, D a 1.618
Shark B a 1.13-1.618, D a 0.886-1.13
Cypher B a 0.382-0.618, C a 1.272-1.414, D a 0.786
Un'impostazione di tolleranza controlla quanto rigorosamente quei rapporti devono essere rispettati, e ogni
rilevamento viene valutato da 0 a 100 in base a quanto si avvicina al rapporto ideale - così un
Gartley da manuale è visibilmente distinto da uno più lasco.
Il backtester - cosa rende questo diverso
Questa è la parte che la maggior parte degli strumenti armonici non ha.
Per ogni modello trovato, l'indicatore simula il trade che quel modello avrebbe
prodotto:
- Un ordine limite viene piazzato al punto di completamento D.
- Se il prezzo raggiunge il target o lo stop PRIMA di toccare D, il setup viene
considerato invalidato e non diventa mai un trade - esattamente come un vero
ordine in attesa verrebbe cancellato.
- Gli ordini non eseguiti scadono dopo 15 barre.
- I trade eseguiti vengono poi seguiti barra per barra per vedere se hanno raggiunto
Target 1, Target 2, o lo stop per primi.
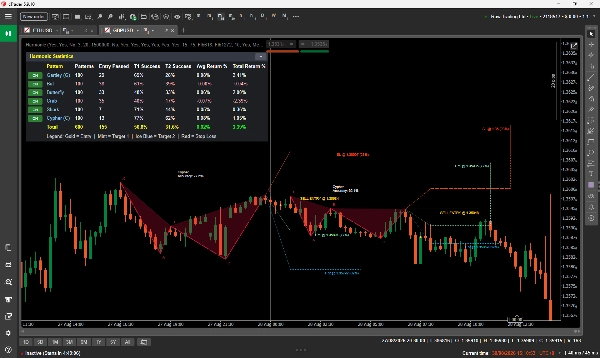
Questi risultati sono compilati in un cruscotto sul grafico che mostra, per tipo di modello:
Modelli trovati | Entrate eseguite | Tasso di successo Target 1 | Tasso di successo Target 2 |
Rendimento medio | Rendimento totale
con una riga totale combinata. Le righe in perdita sono evidenziate, e ogni tipo di modello
ha un pulsante ON/OFF che lo filtra immediatamente dal grafico. Il pannello
si riduce a una singola barra del titolo quando vuoi una vista chiara.
Puoi vedere a colpo d'occhio che, per esempio, Cypher si esegue raramente ma converte
spesso su questa coppia, mentre Crab si esegue di più e converte meno. Questa è una
valutazione su cui puoi agire - ed è misurata sui dati del tuo broker, non
citata da un libro.
Come leggere il grafico
Ogni modello è disegnato come il suo scheletro X-A-B-C-D con triangoli ombreggiati. L'
ombreggiatura non è decorativa: più spesso quel tipo di modello ha raggiunto Target 1 nel
backtest, più solida è la sua riempitura, così le strutture affidabili risaltano
immediatamente.
Ogni modello porta il suo piano di trading completo:
Linea di ingresso oro, etichettata BUY ENTRY / SELL ENTRY con il prezzo esatto
Target 1 menta, etichettato con il prezzo e il tasso di successo T1 di quel modello
Target 2 azzurro ghiaccio, stesso trattamento
Stop loss rosso
Lo stile della linea ti dice cosa è successo. Un livello che il prezzo ha effettivamente raggiunto è
disegnato SOLIDO e si ferma sulla barra in cui è stato colpito. Un livello mai raggiunto
rimane PUNTINATO e si estende fino alla fine del setup. Un punto oro segna la
barra di conferma. Le etichette si trovano alla fine della propria linea, con una linea guida disegnata
ogni volta che una deve essere spostata per rimanere leggibile.
Il nome del modello e la precisione sono stampati accanto a ogni struttura, posizionati sotto
i setup rialzisti e sopra quelli ribassisti così non si sovrappongono all'azione del prezzo.
Impostazioni chiave
Includi modelli rialzisti / ribassisti Filtro direzione del trade
Abilita Gartley ... Abilita Cypher Disattiva completamente singoli modelli
Ricerca pivot Profondità minima / massima Gamma di sensibilità dello swing (3-20). Un
minimo più alto trova strutture meno numerose ma più grandi
Strutture
Errore consentito rapporto Fib % Tolleranza del rapporto. Il 15% è un valore
predefinito bilanciato; abbassalo per rilevamenti solo da manuale
Stop Loss Distanza Posizionamento dello stop oltre D, come
percentuale dell'intervallo AD
Target 1 / Target 2 Rapporto Multipli di Fibonacci di AD
Barre storiche da scansionare Profondità della scansione e quindi
campione statistico
Numero massimo di modelli da disegnare Chiarezza del grafico vs completezza
Mostra cruscotto statistiche Cruscotto on/off
Colori e dimensione del font Controllo visivo completo
A chi è rivolto
Adatto a trader che già comprendono i modelli armonici e vogliono il
lavoro noioso automatizzato più prove allegate - e a trader intermedi che
conoscono le forme ma non sono sicuri di quali fidarsi.
È veramente utile per trader swing e intraday su qualsiasi strumento e qualsiasi
timeframe: forex, indici, materie prime e crypto funzionano tutti, perché la logica
è pura geometria dei prezzi.
Se non hai mai incontrato un modello armonico prima, leggi prima le basi.
L'indicatore li troverà per te, ma presume che tu sappia cosa un Gartley
sta cercando di dirti.
Uso tipico
1. Allegalo a un grafico e lascia che il cruscotto costruisca il suo campione.
2. Guarda quali tipi di modelli effettivamente performano su quello strumento e
timeframe, e disattiva quelli deboli.
3. Aspetta un nuovo completamento a D, controllando il punteggio di accuratezza e il
tasso di successo storico di quel tipo.
4. Usa l'ingresso, lo stop e i target disegnati come piano, dimensionati al tuo rischio.
Note importanti - si prega di leggere
- Questo è uno STRUMENTO DI ANALISI. Non piazza, modifica o chiude alcun ordine.
Non c'è trading automatico e non tocca mai il tuo conto.
- Le performance passate non sono una previsione. Il cruscotto riporta cosa questi
modelli hanno fatto storicamente sui dati caricati. È una prova per una
decisione, non una garanzia della successiva.
- Le statistiche hanno bisogno di un campione. cTrader fornisce a un indicatore solo le barre che
il grafico ha effettivamente caricato, quindi scorri indietro per caricare la storia prima di giudicare
i numeri - la differenza tra poche centinaia di barre e diverse
migliaia è la differenza tra rumore e un campione utilizzabile.
- I rendimenti sono mostrati come percentuale del prezzo. Una coppia forex mostrerà naturalmente
percentuali più piccole rispetto a un indice o una materia prima; confronta simili con
simili.
- I tassi di esecuzione degli ingressi sono realisticamente bassi per progettazione. Molti setup armonici
non si eseguono mai perché il prezzo si allontana da D prima. L'indicatore conta
quelli onestamente come non eseguiti piuttosto che abbellire le statistiche.
- Le scansioni profonde fanno un vero lavoro. Se alzi il conteggio delle barre su una macchina lenta
e vedi una pausa ad ogni nuova barra, riduci le Barre Storiche da Scansionare o aumenta
la profondità minima del pivot.
Solo analisi. Nessun DLL. Nessuna connessione esterna. Non invia, modifica o
chiude mai un ordine.
Riepilogo
A key feature is its integrated backtester, which simulates trades for each pattern found on the chart’s historical data. It places hypothetical limit orders at pattern completion points (D), tracks whether targets or stops are hit, and accounts for unfilled orders and invalidated setups. Results are summarized in an on-chart dashboard showing statistics such as patterns found, entries filled, hit rates for two targets, average and total returns per pattern type, with options to filter patterns on or off.
Patterns are visually displayed with their X-A-B-C-D structure, trade entry, stop loss, and target levels, using line styles and shading to indicate historical success rates and trade outcomes. The indicator supports customization of pattern inclusion, pivot sensitivity, Fibonacci ratio tolerance, stop and target distances, and visual settings.
Designed for traders familiar with harmonic patterns, it suits swing and intraday trading across instruments and timeframes including forex, indices, commodities, and crypto. It functions solely as an analysis tool without order execution capabilities.