Penerangan
Index Hunter: Gambaran Keseluruhan
Index Hunter adalah penunjuk teknikal khusus dan sistem sokongan keputusan yang direka terutamanya untuk indeks volatiliti tinggi seperti US30 (Dow Jones) dan NAS100 (Nasdaq). Berbeza dengan penunjuk standard yang hanya menunjukkan data lalu, Index Hunter memberi tumpuan kepada "Ramalan Vektor"—mencuba untuk meramalkan di mana harga mungkin berada 4 lilin ke hadapan berdasarkan halaju semasa (cerun) merentasi pelbagai jangka masa.
1. Mekanik Teras (Bagaimana Ia Berfungsi)
A. Enjin Ramalan "Vektor"
Ini adalah inti alat ini. Ia tidak hanya melihat harga semasa; ia mengira kadar perubahan (Cerun) merentasi jangka masa M5, M15, dan H1 untuk melukis "Jalur Masa Depan" pada carta anda.
- Mekanik: Ia mengira purata berwajaran momentum dari pelbagai jangka masa untuk meramalkan 4 titik (P1, P2, P3, P4) ke masa depan.
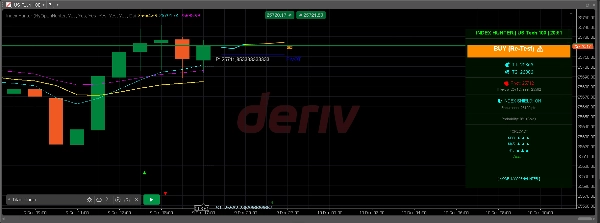
- Visual: Anda melihat jalur berwarna (Sian -> Kuning -> Jingga) yang memanjang ke kanan harga, memvisualisasikan inersia pasaran.
- Jalur Hantu: Ia juga mengingati ramalan sebelumnya (Jalur Hantu) supaya anda dapat melihat jika pasaran menghormati ramalan algoritma yang lalu (sebagai "semakan realiti").
B. Sistem Visual Berlapis-Lapis
Ia menindih tahap institusi kritikal secara automatik:
- Titik Pivot (Fleksibel): Mengira secara automatik tahap Pivot, R1/S1, dan R2/S2 berdasarkan jangka masa yang boleh dipilih (H12, Harian, Hari2, atau Hari3).
- Tahap Psikologi: Melukis "Garis Psikologi" pada setiap selang 100 mata (contoh, 34000, 34100), yang sering bertindak sebagai zon magnet untuk indeks.
- Tinggi/Rendah Harian: Menandakan julat hari sebelumnya untuk menunjukkan zon pecahan atau penolakan.
- Fraktal: Mengenal pasti puncak dan dasar tempatan dengan anak panah (▲ ▼) untuk penempatan masuk/stop-loss yang tepat.
C. Logik "Keyakinan" & Kebolehlaksanaan
Alat ini tidak hanya memberikan isyarat; ia menilai isyarat tersebut.
- Pengiraan: Ia mengukur jarak ke sasaran keuntungan anda dan membandingkannya dengan tenaga pasaran semasa (ATR - Julat Benar Purata).
- Output:
-
- PANAS (>80%): Momentum kuat + Jarak sasaran munasabah.
- HANGAT (50-80%): Persediaan sederhana.
- SEJUK (<50%): Pasaran menganggap kebarangkalian mencapai sasaran rendah (contohnya, sasaran terlalu jauh untuk volatiliti semasa).
D. Mekanik "Perisai" Akaun
Ia termasuk pengurus risiko pasif pada panel:
- Metrik Ketahanan: Mengira berapa banyak "mata" pasaran boleh bergerak menentang anda sebelum akaun anda dalam bahaya, berdasarkan baki dan saiz lot minimum anda.
- Status: Memaparkan "🛡️ PERISAI INDEKS: HIDUP" jika akaun anda selamat berbanding volatiliti semasa (ATR), atau "⚠️ MARGIN RENDAH" jika volatiliti terlalu tinggi untuk baki anda.
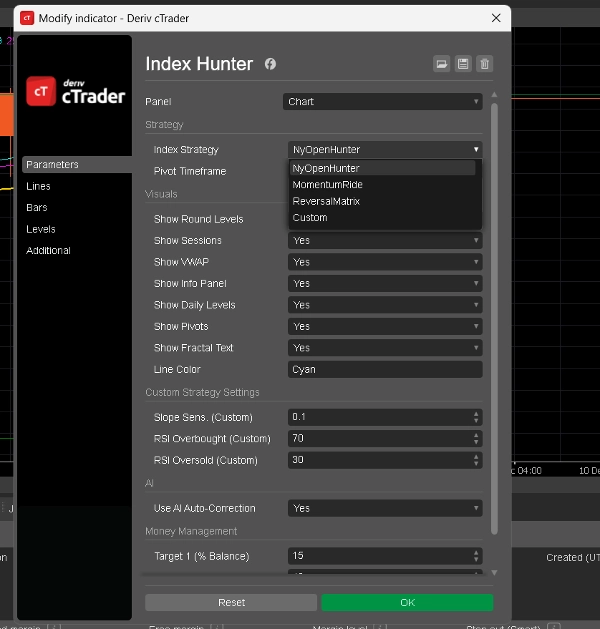
2. Mod Tersedia (Strategi)
Anda boleh bertukar antara mod ini dalam tetapan penunjuk (
Strategi Indeks
parameter). Setiap mod mengubah cara AI mentafsir pasaran.
1. Mod: NyOpenHunter (Scalper New York)
- Terbaik Untuk: 2-3 jam pertama yang kacau bilau semasa Pembukaan Pasaran AS.
- Logik:
-
- Masa Aktif: 13:00 - 17:00 UTC (anggaran).
- Pencetus: Ia mencari Cerun M5 lebih besar daripada 0.1 (atau kurang daripada -0.1).
- Falsafah: "Tangkap letupan." Ia menunggu lonjakan awal volum pada loceng NY dan memberi isyarat untuk menunggang gelombang tersebut.
- Sentimen Panel: Memaparkan "NY OPEN BELI 🚀" atau "NY OPEN JUAL 🔻".
2. Mod: MomentumRide (Pengikut Trend)
- Terbaik Untuk: Trend kuat dan berterusan di luar waktu pembukaan.
- Logik:
-
- Pencetus: Memerlukan Cerun M5 yang lebih kuat (> 0.2) daripada mod NY.
- Falsafah: "Jangan terpotong." Ia mengabaikan pergerakan lemah dan hanya memberi isyarat apabila pasaran bergerak dengan keyakinan yang signifikan.
- Sentimen Panel: Memaparkan "MOMENTUM NAIK 🟢" atau "MOMENTUM TURUN 🔴".
3. Mod: ReversalMatrix (Lawan Trend)
- Terbaik Untuk: Pasaran yang bergerak dalam julat atau menangkap puncak/dasar.
- Logik:
-
- Pencetus: Menggunakan RSI (Indeks Kekuatan Relatif).
-
- Isyarat Jual: RSI > 75 (Terlalu Beli).
- Isyarat Beli: RSI < 25 (Terlalu Jual).
- Falsafah: "Lunturkan ekstrem." Ia mengenal pasti apabila getah diregangkan terlalu jauh dan kemungkinan akan kembali semula.
- Sentimen Panel: "TERLALU BELI (JUAL SEGERA)" atau "TERLALU JUAL (BELI SEGERA)".
4. Mod: Tersuai (Ditakrifkan Pengguna)
- Terbaik Untuk: Pengguna maju yang ingin melaras bot.
- Logik: Membolehkan anda menetapkan ambang sendiri untuk Sensitiviti Cerun dan tahap RSI dalam tetapan.
-
- Contoh: Anda boleh mencipta strategi hibrid yang hanya membeli jika Cerun > 0.05 DAN RSI < 40.
3. "Panel Maklumat" (Paparan Kepala)
Panel visual di sebelah kanan carta menggabungkan semua data ini:
- Tajuk: Memaparkan mod dan simbol semasa.
- Keutamaan: Bias AI utama (contohnya, "BELI 34150 ▲").
- Sasaran (T1, T2): Sasaran keuntungan dinamik yang dikira berdasarkan tetapan peratus akaun anda dan volatiliti.
- Ramalan: Analisis berurutan trend M30, M45, dan H1 (contohnya, "M30: ▲ ▲ ▲" bermaksud penjajaran beli kuat).
- Kebarangkalian: Skor keyakinan AI (Panas/Hangat/Sejuk).
Ringkasan
Key features include an automatic overlay of institutional levels such as pivot points (with selectable timeframes), psychological price levels at 100-point intervals, previous day’s high/low, and fractals marking local tops and bottoms. It incorporates a confidence grading system (Hot, Warm, Cold) based on momentum strength and volatility relative to profit target distance.
Index Hunter includes a risk management "Shield" that assesses account safety by calculating potential adverse market moves against account balance and lot size, displaying status alerts accordingly.
The indicator offers four operational modes: NyOpenHunter (New York market open scalping), MomentumRide (trend following), ReversalMatrix (counter-trend using RSI), and a Custom mode for user-defined slope and RSI thresholds. A comprehensive info panel consolidates mode, bias, dynamic targets, trend forecasts, and confidence scores for decision support.
Ulasan pelanggan
5 | 67 % | |
4 | 33 % | |
3 | 0 % | |
2 | 0 % | |
1 | 0 % |