
Penerangan
Pesanan Kluster Kecairan (LCO) 🔍💧
1. Apa yang LCO tunjukkan
Pesanan Kluster Kecairan secara automatik mengesan dan melukis:
- Kluster kecairan menaik (zon permintaan / pengumpulan potensi) ✅
- Kluster kecairan menurun (zon bekalan / pengedaran potensi) 🔻
Setiap kluster adalah:
- berpaut pada bar pivot volum (maksimum volum tempatan),
- diklasifikasikan sebagai menaik atau menurun berdasarkan lanjutan harga terkini,
- dilanjutkan ke hadapan dalam masa sehingga harga mengurangkan (menggunakan) kluster tersebut.
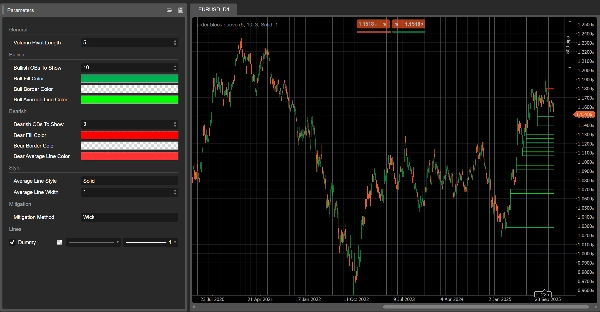
Pada carta anda akan melihat:
- Segi empat hijau → kluster kecairan menaik
- Segi empat merah → kluster kecairan menurun
- Satu garis kelabu di dalam setiap segi empat → paras harga purata kluster tersebut
Setelah kluster dianggap dikurangkan, ia hilang dari carta dan hanya kluster aktif yang kekal.
2. Logik pengesanan (dalam istilah mudah)
- Pivot volum
-
- LCO mengimbas bar di mana volum lebih tinggi daripada bar Volume Pivot Length sebelumnya dan seterusnya.
- Bar-bar ini adalah pivot volum – potensi titik tumpuan untuk kluster kecairan.
- Konteks: menaik vs menurun
-
- Perilaku harga terkini menentukan konteks:
-
- Konteks menaik → lanjutan ke bawah telah menguasai.
- Konteks menurun → lanjutan ke atas telah menguasai.
- Konteks ini menentukan sama ada pivot volum seterusnya akan mencipta kluster menaik atau kluster menurun.
- Kluster kecairan menaik
Dalam konteks menaik: -
- Bawah kluster = rendah bar pivot
- Atas kluster = titik tengah bar ((tinggi + rendah) / 2)
- Interpretasi: zon di mana tekanan ke bawah diserap dan pembeli masuk dengan agresif.
- Kluster kecairan menurun
Dalam konteks menurun: -
- Bawah kluster = titik tengah bar pivot
- Atas kluster = tinggi bar pivot
- Interpretasi: zon di mana tekanan ke atas diserap dan penjual mengambil alih.
- Garis purata
-
- Untuk setiap kluster, LCO mengira purata atas & bawah dan melukis garis tengah kelabu.
- Ini bertindak sebagai paras keseimbangan dalaman kluster.
- Pengurangan (penggunaan kluster)
Pada setiap bar baru, LCO memeriksa jika kluster dikurangkan: -
- Untuk kluster menaik:
-
- Ia mengesan harga sasaran ke bawah sepanjang Volume Pivot Length bar:
-
Kaedah Pengurangan = Wick→ rendah terendah.Kaedah Pengurangan = Close→ tutup terendah.
- Jika harga sasaran ini turun di bawah bawah kluster, kluster menaik dianggap dikurangkan dan dikeluarkan.
- Untuk kluster menurun:
-
- Ia mengesan harga sasaran ke atas:
-
Wick→ tinggi tertinggi.Close→ tutup tertinggi.
- Jika harga sasaran ini naik di atas atas kluster, kluster menurun dianggap dikurangkan dan dikeluarkan.
Dikurangkan = kecairan dalam kluster itu dianggap digunakan / tidak sah.
3. Cara membaca LCO pada carta
Anda akan melihat terutamanya:
- Kluster hijau di bawah harga → potensi zon kecairan permintaan
- Kluster merah di atas harga → potensi zon kecairan bekalan
Pembacaan tipikal (bukan nasihat perdagangan):
- Kluster segar
-
- Kluster yang baru dicipta sering lebih relevan:
-
- Kluster menaik di bawah harga → kawasan di mana pembeli terakhir menyerap tekanan jualan.
- Kluster menurun di atas harga → kawasan di mana penjual terakhir menyerap tekanan pembelian.
- Ujian semula kluster
-
- Harga kembali ke kluster menaik dari atas:
-
- Jika harga bertindak balas dan mengekalkan bawah → kemungkinan pantulan / zon reaksi panjang.
- Harga kembali ke kluster menurun dari bawah:
-
- Jika harga gagal berdagang di atas atas → kemungkinan penolakan / zon reaksi pendek.
- Kluster dikurangkan vs aktif
-
- Apabila harga memotong kluster melebihi sempadannya mengikut kaedah pengurangan yang dipilih,
→ kluster kecairan itu dikeluarkan pada bar berikutnya. - Kluster yang masih kelihatan adalah zon kecairan aktif yang belum sepenuhnya dilalui perdagangan.
- Apabila harga memotong kluster melebihi sempadannya mengikut kaedah pengurangan yang dipilih,
- Menggunakan garis tengah
-
- Garis tengah kelabu itu boleh digunakan sebagai:
-
- paras pengambilan untung atau keluar separa dalam kluster,
- rujukan “harga adil” dalam zon kecairan,
- cara cepat untuk melihat sama ada harga berdagang di bahagian atas atau bawah kluster.
4. Parameter (Bahasa Inggeris)
Panjang Pivot Volum
- Bar yang digunakan untuk:
-
- mengesan pivot volum,
- mengira ekstrem dan sasaran pengurangan.
- Nilai lebih rendah → lebih banyak kluster, lebih banyak bunyi;
- Nilai lebih tinggi → kluster lebih sedikit, lebih signifikan.
Kluster Kecairan Menaik Untuk Ditunjukkan
(bekas OB Menaik Untuk Ditunjukkan)
- Bilangan maksimum kluster menaik yang dipaparkan pada carta.
Kluster Kecairan Menurun Untuk Ditunjukkan
(bekas OB Menurun Untuk Ditunjukkan)
- Bilangan maksimum kluster menurun yang dipaparkan.
Warna Isian Bull / Warna Isian Bear
- Warna isian kluster menaik/menurun.
- Anda boleh memasukkan nilai alfa (ketelusan).
Warna Garis Purata Bull/Bear
- Warna garis tengah dalaman untuk setiap kluster.
Gaya Garis Purata
- Gaya visual untuk garis tengah:
"Solid","Dashed","Dotted".
Lebar Garis Purata
- Ketebalan garis tengah.
Kaedah Pengurangan
"Wick"→ pengurangan berdasarkan wick tinggi/rendah (lebih sensitif)."Close"→ pengurangan berdasarkan harga penutupan (lebih konservatif).
Ringkasan
On the chart, bullish clusters appear as green rectangles below the price, indicating areas where buyers absorbed selling pressure. Bearish clusters are shown as red rectangles above the price, marking zones where sellers absorbed buying pressure. Each cluster includes a grey mid-line representing the average price level, serving as an internal equilibrium reference.
Clusters extend forward in time until price "mitigates" or consumes them, at which point they disappear, leaving only active liquidity zones visible. Mitigation is determined by tracking price extremes (high/low wicks or closing prices) over a configurable number of bars.
Key parameters include the volume pivot length (defining sensitivity and cluster significance), maximum clusters displayed, cluster colors, mid-line style, and mitigation method. LCO supports various markets including forex, indices, commodities, stocks, and cryptocurrencies, and integrates with multiple trading strategies and indicators such as RSI, MACD, Bollinger Bands, and Fibonacci levels.
Ulasan pelanggan
5 | 100 % | |
4 | 0 % | |
3 | 0 % | |
2 | 0 % | |
1 | 0 % |


