
説明
═══════════════════════════════════════════════════════════════
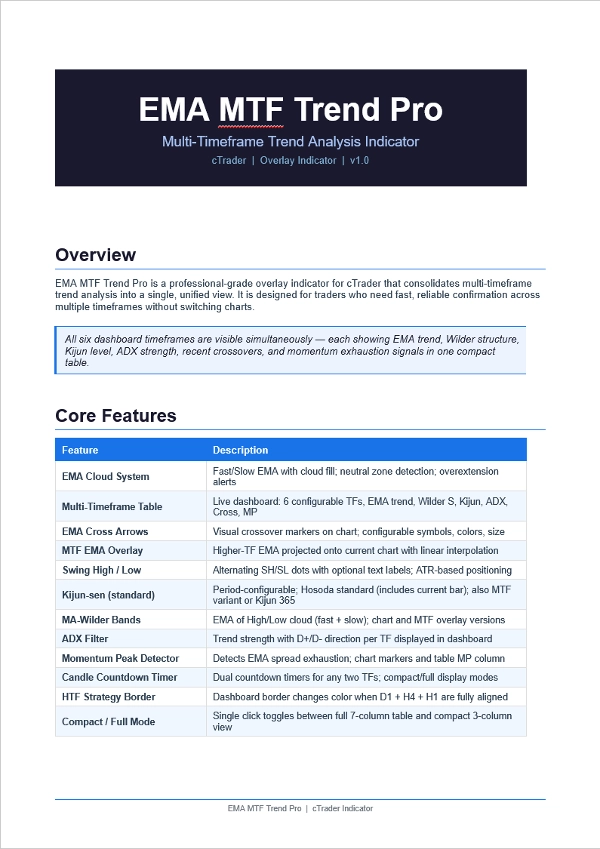
EMA MTF TREND PRO — マルチタイムフレームトレンド分析インジケーター
cTrader オーバーレイインジケーター
═══════════════════════════════════════════════════════════════
6つのタイムフレーム全体のトレンド状況を一つのテーブルで、
ウィンドウを切り替えることなく、1つのチャート上で確認できます。
───────────────────────────────────────────────────────────────
機能概要
───────────────────────────────────────────────────────────────
EMA MTF Trend ProはEMAのトレンド方向、ワイルダーチャネル構造、
基準線レベル、ADXの強さ、クロスオーバーシグナル、
モメンタムの消耗を一つのライブダッシュボードに統合します。
テーブルの各行は異なるタイムフレームを表し、各列はそのタイムフレームに関する
異なる質問に答えます。一目でタイムフレームの一致と
エントリーの安全性がわかります。
───────────────────────────────────────────────────────────────
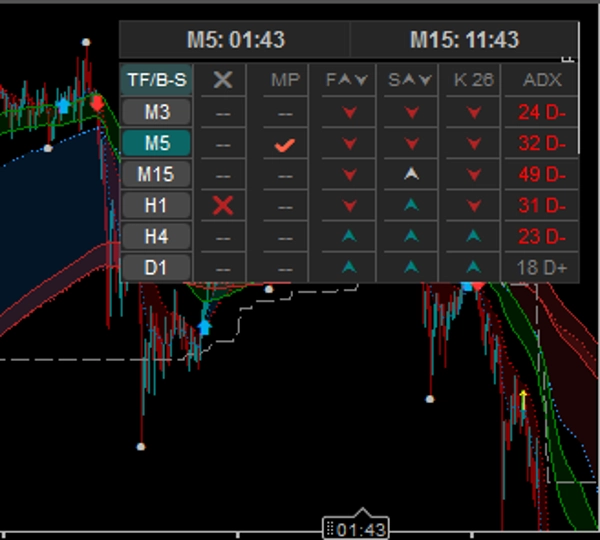
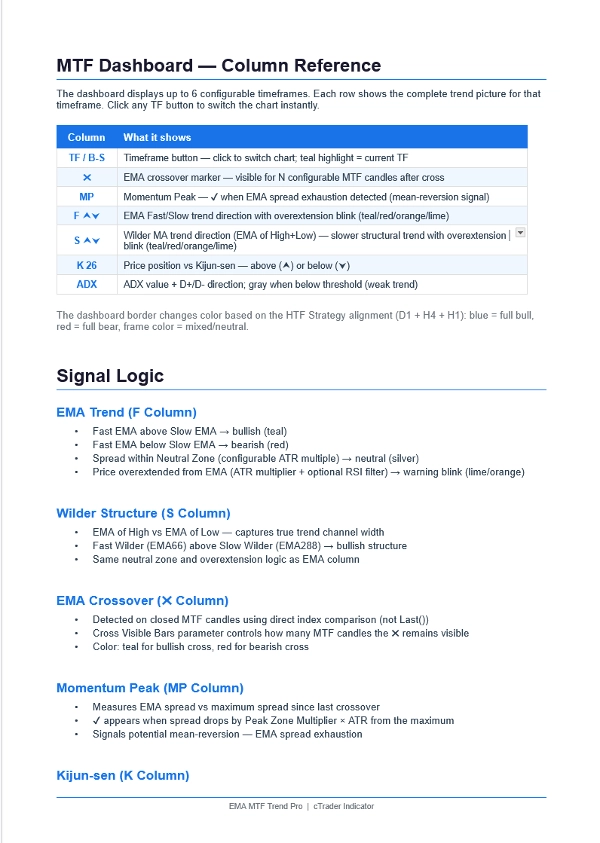
ダッシュボード — 6タイムフレーム × 7列
───────────────────────────────────────────────────────────────
列の内容
──────── ──────────────────────────────────────────────────
TF/B-S タイムフレームボタン — クリックでチャートを即切替
青緑色のハイライト = 現在表示中のタイムフレーム
✖ EMAクロスオーバー — 設定可能なN本のローソク足に表示
青緑色 = 強気クロス | 赤 = 弱気クロス
MP モメンタムピーク — ✔ はEMAの広がりが消耗した状態
平均回帰の警告シグナル
F ⮝⮟ EMAの高速と低速のトレンド方向
青緑色 = 上昇 | 赤 = 下降 | 銀色 = 中立
価格がEMAから過剰に離れると点滅
S ⮝⮟ ワイルダーMA構造(高値/安値のEMA)
より遅く、より構造的なトレンドフィルター
K 26 価格と基準線の比較
⮝ = 価格が上(サポート) | ⮟ = 下(レジスタンス)
ADX トレンド強度 + D+/D- 方向
灰色 = 弱い/レンジ相場(閾値以下)
───────────────────────────────────────────────────────────────
機能
───────────────────────────────────────────────────────────────
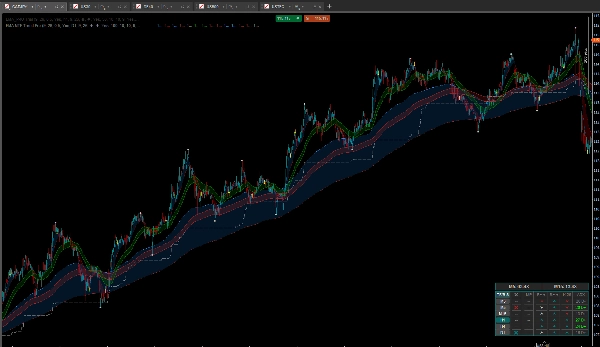
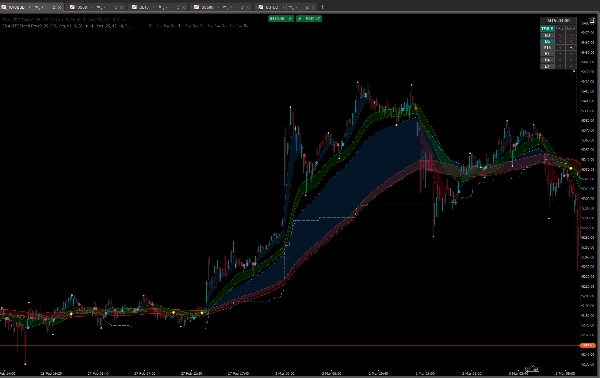
EMAクラウドシステム
• 高速+低速EMAのカラフルなクラウド塗りつぶし
• 中立ゾーン検出(設定可能なATR乗数)
• RSIフィルター付きの過剰拡張アラート
MTF EMAオーバーレイ
• 任意の上位タイムフレームEMAを現在のチャートに投影
• 線形補間 — 滑らかな線、段差なし
• 設定可能なシンボルと色のクロスオーバー矢印
• ダッシュボードで上位TF選択時にオーバーレイ矢印を自動非表示
(視覚的な混乱を防止)
スイング高値&安値
• 交互に表示されるSH / SLドット — 連続した重複高値なし
• ATRベースの位置調整付きのオプションのSH / SLテキストラベル
• 設定可能なドットサイズ、ラベルサイズ、色
• スイング表示全体のオン/オフ切替
基準線(キジュンセン)
• 標準的な細田定義(TradingView / MT4と同じ)
• 設定可能な期間
• チャート上のMTFオーバーレイラインとしても利用可能
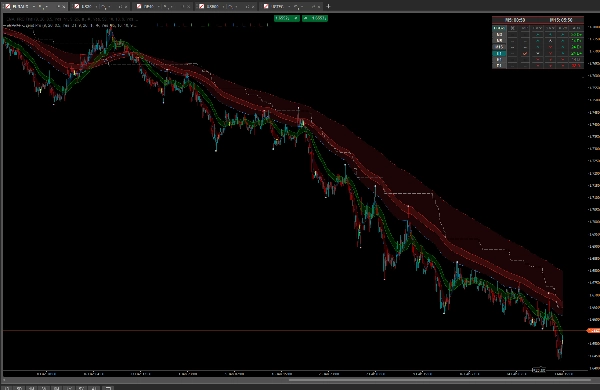
MA-ワイルダーバンド
• 高値のEMAと安値のEMA — トレンドチャネルを作成
• 高速バンド(EMA66)+低速バンド(EMA288)
• チャート上およびMTFオーバーレイで利用可能
HTF戦略ボーダー
• D1 + H4 + H1がすべて強気(EMA + ワイルダーが一致)で
ダッシュボードの枠が青緑色に変わる
• 3つすべてが弱気の場合は赤に変わる
• 完全なマルチTF整合の即時視覚確認
ローソク足カウントダウンタイマー
• デュアルタイマー — 任意の2つのタイムフレーム
• 2つ目のタイマーは現在のチャートTFに追従可能
• シングルカラムモードでコンパクトなレイアウト
コンパクト / フルモード
• TF/B-Sヘッダーをクリックして切替
• フルモード:7列(すべてのシグナル)
• コンパクトモード:3列(TF、EMA、ワイルダー)— 最小スペース
───────────────────────────────────────────────────────────────
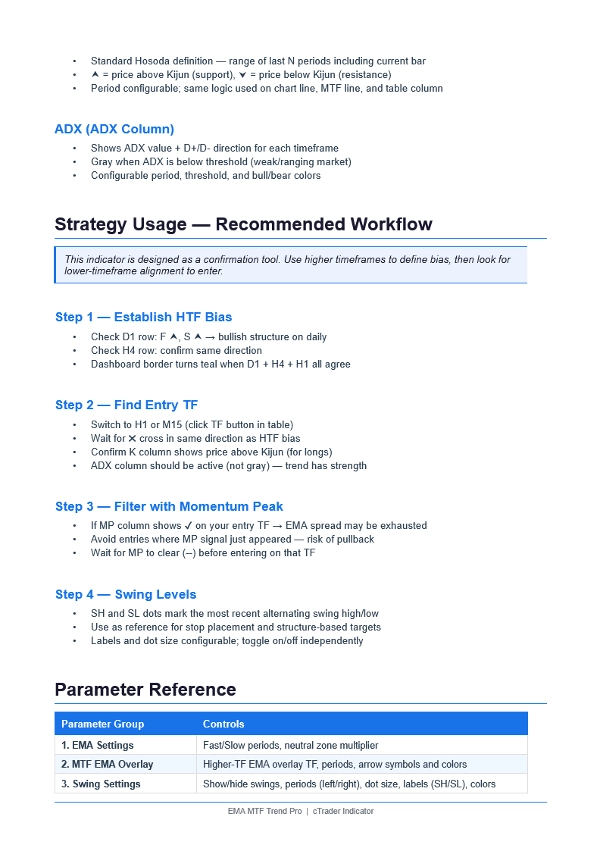
戦略 — 使い方
───────────────────────────────────────────────────────────────
ステップ1 — バイアスの確立(上位タイムフレーム)
• D1行:F ⮝ + S ⮝ = 強気の日足構造
• H4行:同じ方向 = トレンド確定
• ダッシュボードの枠が青緑色 = D1 + H4 + H1がすべて同意
ステップ2 — エントリーの発見(下位タイムフレーム)
• テーブル内のH1またはM15をクリックしてチャートを切替
• HTFバイアスと同じ方向の✖クロスを待つ
• K列はロングの場合⮝(価格が基準線上)を示す
• ADX列がアクティブで灰色でない(トレンドに強さあり)
ステップ3 — モメンタムピークでフィルター
• MP列が✔を示す → EMAの広がりが消耗 → エントリー回避
• エントリー前にMPがクリア(--)されるのを待つ
• EMAの極端な位置でのエントリーを避けるために下位TFで使用
ステップ4 — スイングレベルを利用
• SHドット = 最新のスイング高値(レジスタンス / ストップ参照)
• SLドット = 最新のスイング安値(サポート / ターゲット参照)
• ドットは交互に表示 — 常に一つの高値、一つの安値
───────────────────────────────────────────────────────────────
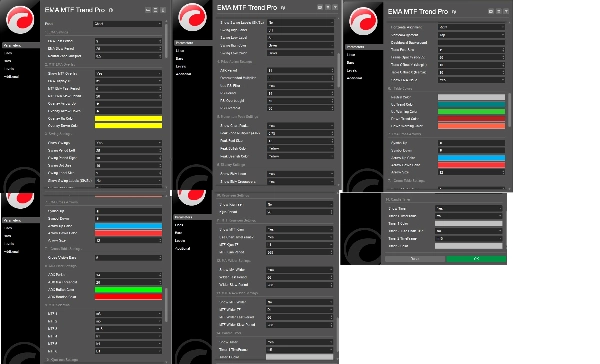
パラメーターグループ
───────────────────────────────────────────────────────────────
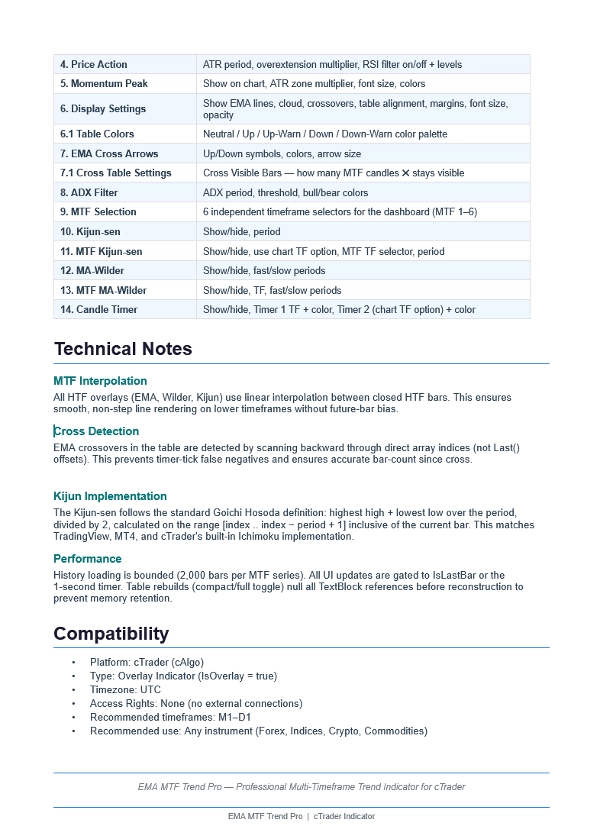
1. EMA設定 — 高速/低速期間、中立ゾーン
2. MTF EMAオーバーレイ — TF、期間、矢印スタイル
3. スイング設定 — 表示/非表示、期間、ラベル、色
4. 価格アクション — ATR、過剰拡張、RSIフィルター
5. モメンタムピーク — ゾーン乗数、フォント、色
6. 表示設定 — 線、クラウド、テーブルレイアウト
6.1 テーブルカラー — フルカラーパレット制御
7. EMAクロス矢印 — シンボル、色、サイズ
7.1 クロステーブル設定 — クロス表示バー(N本のローソク足)
8. ADXフィルター — 期間、閾値、色
9. MTF選択 — 6×独立したTFセレクター
10. 基準線(キジュンセン) — 表示/非表示、期間
11. MTF基準線 — TF、期間、チャートTFオプション
12. MA-ワイルダー — 表示/非表示、高速/低速期間
13. MTF MA-ワイルダー — TF、高速/低速期間
14. ローソク足タイマー — TF、色、チャートTFオプション
───────────────────────────────────────────────────────────────
概要
カスタマーレビュー
5 | 0 % | |
4 | 100 % | |
3 | 0 % | |
2 | 0 % | |
1 | 0 % |


