
Descrição
Visão Geral
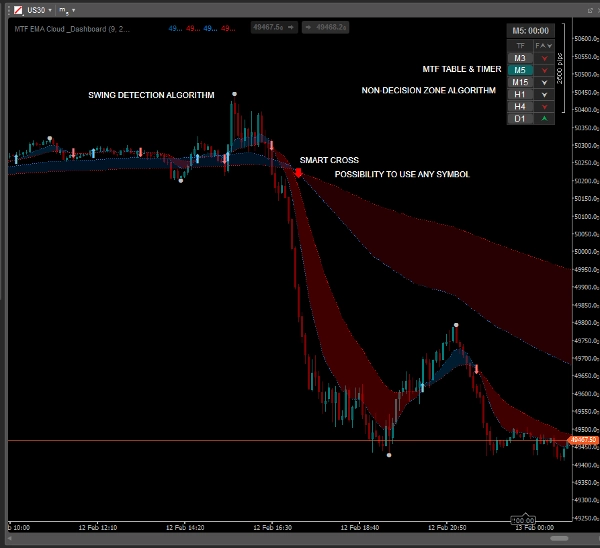
Pare de adivinhar a direção do mercado. EMA MTF Cloud & Dashboard é um conjunto completo de ferramentas de acompanhamento de tendência projetado para scalpers e traders diários. Ele combina a suavidade das Médias Móveis Exponenciais com o poder da análise Multi-Temporal, tudo em uma interface limpa de gráfico.
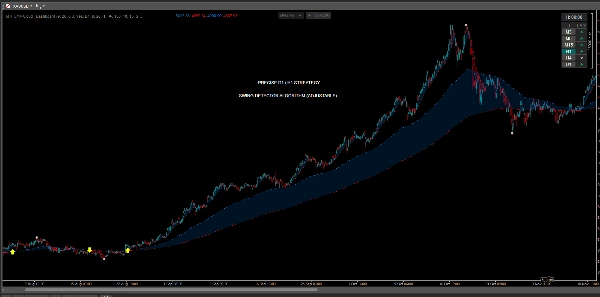
Ao contrário dos indicadores padrão, esta ferramenta inclui uma Lógica de Zona Neutra Inteligente para filtrar mercados instáveis, poupando você de sinais falsos durante períodos de estabilidade.
Principais Características
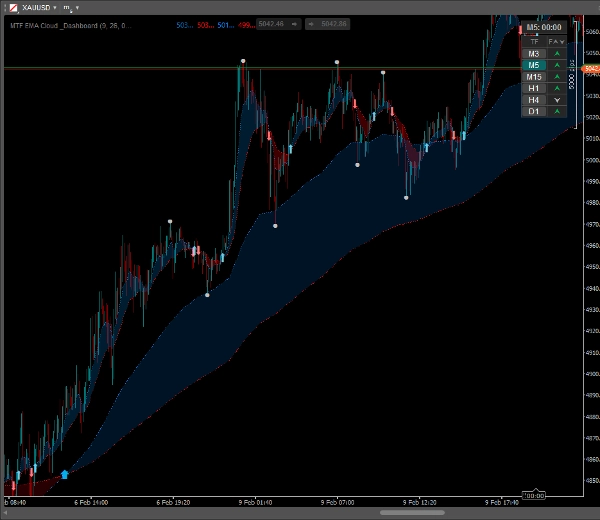
✅ Nuvens EMA Dinâmicas
Visualize a tendência instantaneamente. O espaço entre as EMAs Rápida e Lenta é preenchido com uma nuvem semi-transparente, facilitando a identificação da força da tendência e possíveis zonas de suporte/resistência.
✅ Sobreposição MTF (Multi-Temporal)
Veja o "Panorama Geral" sem trocar de gráfico. Exiba EMAs de períodos maiores (ex.: H1) diretamente no seu gráfico de período menor (ex.: M5).
- Inclui setas de cruzamento separadas para a tendência MTF!
✅ Painel de Tendência Inteligente
Uma tabela compacta e clicável que mostra o status da tendência para 6 períodos (M3 a Diário).
- Lógica da Zona Neutra: O painel detecta mercados estáveis (consolidação) e os marca em cinza/prata, ajudando você a evitar negociações ruins.
- Interativo: Clique em qualquer botão de período na tabela para mudar o gráfico instantaneamente.
✅ Pontos de Swing High / Swing Low
Marca automaticamente topos e fundos locais significativos. Perfeito para posicionar Stop Loss ou identificar níveis de Take Profit baseados na estrutura recente de preços.
✅ Sinais Visuais de Cruzamento
Setas claras e personalizáveis aparecem exatamente quando a EMA Rápida cruza a EMA Lenta.
- Personalize cores, tamanhos e estilos das setas.
✅ Temporizador de Candle
Um temporizador embutido mostra exatamente quanto tempo falta para o fechamento do candle, essencial para cronometrar suas entradas.
Como Operar (Exemplo de Estratégia)
- Verifique o Painel: Certifique-se de que os períodos maiores (ex.: H1, H4) estejam alinhados (Verde/Vermelho). Evite operar se estiverem "Neutros" (Cinza).
- Espere o Sinal: Procure uma seta de cruzamento na direção da tendência principal.
- Confirme com a Ação do Preço: Use os pontos "Swing High/Low" para confirmar a estrutura do mercado.
- Entre e Gerencie: Entre no fechamento do candle. Use a Nuvem EMA como suporte dinâmico para ajustar seu stop loss.
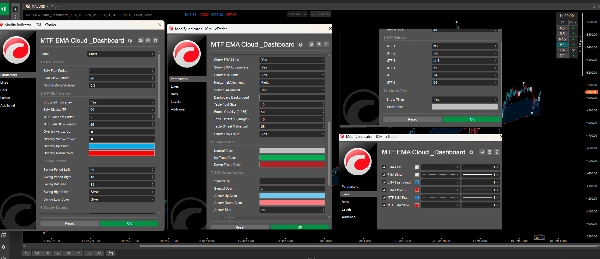
Personalização
O indicador é altamente personalizável para se adequar ao seu estilo:
- Ajuste os períodos das EMAs para os modos atual e MTF.
- Altere as cores das Nuvens, Setas, Swings e do Painel.
- Configure a posição e transparência do Painel.
- Ative ou desative qualquer recurso independentemente.
Resumo
A smart dashboard displays trend status across six timeframes (from 3 minutes to daily), incorporating a neutral zone logic that highlights flat or consolidating markets to help avoid false signals. The dashboard is interactive, enabling quick chart switching by clicking on timeframe buttons. The tool automatically marks swing high and low points to assist in setting stop loss and take profit levels based on recent price structure. Visual crossover arrows signal EMA fast and slow line crossovers, with customizable colors and styles. Additionally, a candle timer shows the remaining time until the current candle closes, aiding precise trade timing.
The indicator is highly customizable, allowing adjustments to EMA periods, colors, dashboard position, transparency, and feature toggling to fit individual trading styles. It supports markets including Forex, Crypto, and commodities like gold (XAUUSD), and is tagged for use with symbols such as BTCUSD and USDJPY.
Avaliações de clientes
5 | 0 % | |
4 | 100 % | |
3 | 0 % | |
2 | 0 % | |
1 | 0 % |


![Logótipo de "High-Low Divergence [Iridio Capital]"](https://cdn.ctrader.com/image/webp/443c4661-7abb-40f1-842f-4b6ec560649b_40914)


