Описание
Двигатель импульсного момента (PME) — это продвинутый адаптивный осциллятор момента с встроенной коррекцией запаздывания и фильтром конъюнкции из 5 условий. Он ускоряется в трендах, замедляется в шуме и показывает только сигналы, которые стоит принимать. Работает на Forex, индексах, золоте, криптовалютах и других рынках — прямо из коробки.
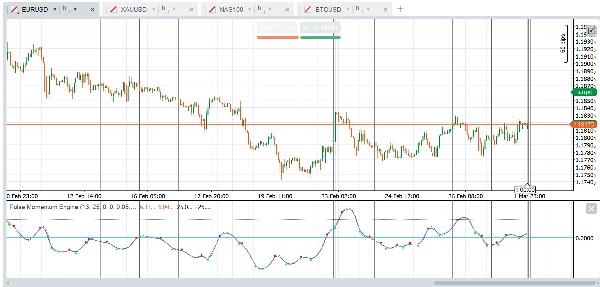
Индикатор отображается как осциллятор в дополнительном окне с основной импульсной линией, опциональной сигнальной линией, фиксированными уровнями перекупленности/перепроданности и опциональными стрелками пересечения, отфильтрованными системой конъюнкции с несколькими условиями.
Группы параметров:
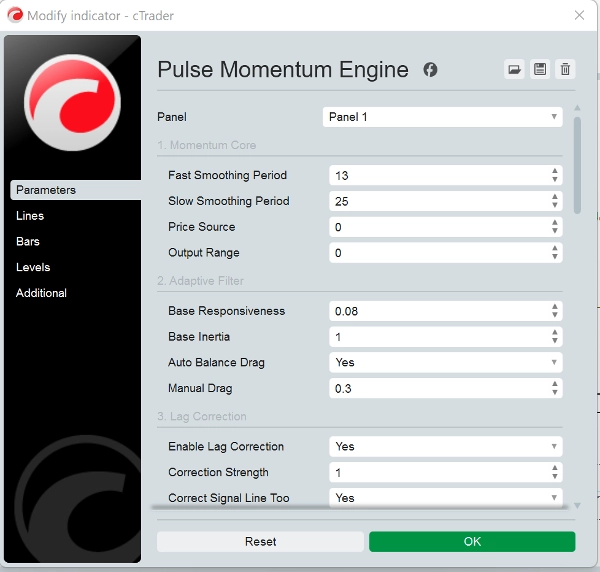
- Ядро момента: Управляет базовым расчетом момента. Диапазон вывода по умолчанию центрирован на 0. При использовании диапазона вывода = 1 (сдвинутый) соответственно настройте уровни OB/OS (например, OB = 70, OS = 30)
- Адаптивный фильтр: Управляет тем, как фильтр отслеживает сигнал момента. Базовая отзывчивость (0.08) определяет, насколько быстро фильтр реагирует на изменения момента. Чем выше — тем быстрее, но шумнее. Базовая инерция (1.0) определяет сопротивление резким изменениям. Чем выше — тем плавнее выход, но больше запаздывание. Автоматический баланс сопротивления (True) автоматически вычисляет оптимальное сопротивление для предотвращения колебаний/осцилляций. Рекомендуется оставлять включенным. Ручное сопротивление (0.3) — коэффициент сопротивления при отключенном автоматическом балансе. Чем выше — тем сильнее демпфирование.
- Коррекция запаздывания: Уменьшает внутреннюю задержку адаптивного фильтра с помощью двухпроходной обратной связи ошибки.
- Динамическое отслеживание: Позволяет фильтру адаптировать свое поведение в зависимости от рыночных условий.
- Механизм адаптации: Управляет общим механизмом адаптации.
- Сигнальная линия: Более медленная эталонная линия, используемая для сигналов на основе пересечений.
- Стрелки пересечения: Визуальные маркеры в точках пересечения основной и сигнальной линий. Примечание: Не перерисовывается: Когда "Требовать подтвержденный бар" включено (по умолчанию), сигналы пересечения появляются только после закрытия бара и никогда не исчезают. Устанавливайте в False только если вам нужны оповещения в реальном времени и вы понимаете, что сигнал может измениться до закрытия бара.
- Фильтр конъюнкции: Требует согласия нескольких условий для отображения стрелки пересечения. Значительно снижает количество ложных сигналов.
- Фиксированные уровни: Простые, постоянные линии перекупленности и перепроданности. Консервативные (меньше сигналов): OB = 40, OS = -40 (центрированные) или OB = 70, OS = 30 (сдвинутые). Агрессивные (больше сигналов): OB = 15, OS = -15 (центрированные) или OB = 60, OS = 40 (сдвинутые).
- Производительность: Максимальное количество баров для расчета установлено в 0. 0 = рассчитывать всю доступную историю. Установите 5000-10000 для очень длинных графиков, чтобы снизить нагрузку на процессор.
Основное использование
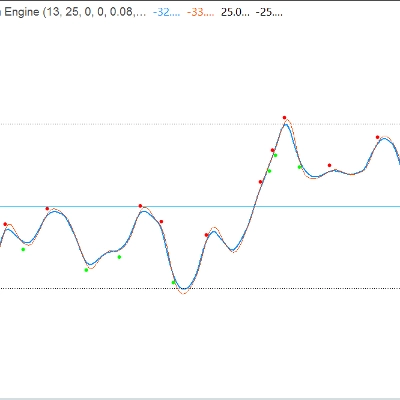
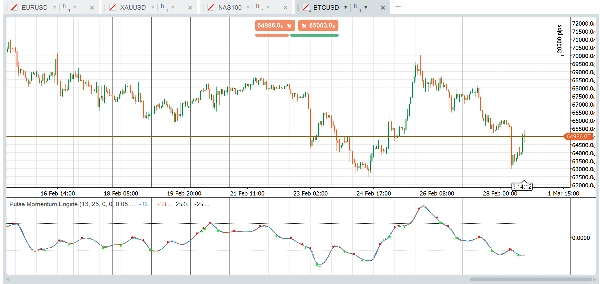
- Направление тренда: Когда импульсная линия (синяя) находится выше нуля и растет, моментум бычий. Ниже нуля и падает — медвежий моментум.
- Сигналы пересечения: Бычий сигнал возникает, когда импульсная линия пересекает сигнальную линию снизу вверх (зеленая стрелка). Медвежий сигнал возникает при пересечении сверху вниз (красная стрелка).
- Зоны перекупленности/перепроданности:
-
- Импульсная линия выше уровня OB → рынок может быть перекуплен сверху. Ищите медвежьи пересечения как потенциальные сигналы разворота.
- Импульсная линия ниже уровня OS → рынок может быть перепродан. Ищите бычьи пересечения как потенциальные сигналы разворота.
- Пересечения, которые происходят в нейтральной зоне (между OB и OS), обычно являются сигналами следования за трендом.
Стратегия фильтра конъюнкции
Конфигурация по умолчанию требует подтверждения 3 из 5 условий для подтверждения пересечения. Это значительно снижает количество ложных сигналов. Вы можете:
- Увеличить минимальное количество условий до 4-5 для меньшего, но более качественного количества сигналов
- Уменьшить минимальное количество условий до 1-2 для большего количества сигналов с меньшим качеством каждого
- Отключить отдельные фильтры для настройки того, какие подтверждения важны для вашей стратегии
Рекомендуемые активы и рынки
Основные валютные пары Forex- EUR/USD, GBP/USD, USD/JPY, AUD/USD (Высокая ликвидность обеспечивает чистые колебания момента. Адаптивный фильтр эффективно справляется с изменчивостью сессий)
Кросс-курсы Forex - EUR/GBP, GBP/JPY, AUD/NZD (Часто демонстрируют более выраженное трендовое поведение, которое фильтр конъюнкции хорошо использует)
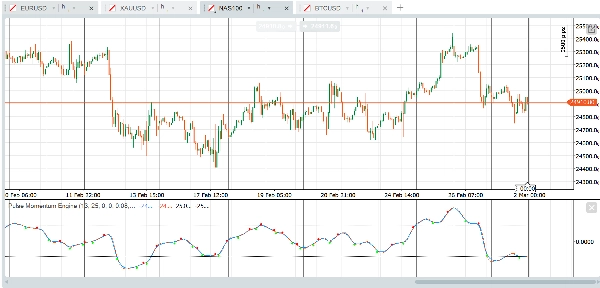
Индексы акций - US30, NAS100, SPX500, GER40 (Постоянные фазовые тренды хорошо сочетаются с адаптивным фильтром. Коррекция запаздывания позволяет рано фиксировать прорывы)
Золото (XAU/USD) - Длительные колебания момента и четкие фазовые тренды хорошо соответствуют конструкции фильтра.
Нефть - WTI, Brent (Сильная устойчивость момента)
Акции с большой капитализацией - AAPL, MSFT, AMZN, TSLA (Участие институциональных инвесторов обеспечивает чистые сигнатуры момента)
Основные криптовалюты - BTC/USD, ETH/USD (Сильные трендовые тенденции. Увеличьте отзывчивость до 0.10 - 0.15 для более быстрых циклов криптовалют).
Менее подходят для неликвидных инструментов (случайные всплески усиливаются как ложные сигналы) и пар с узким диапазоном (индикатор дает мало полезной информации).
Что касается таймфрейма, настройка по умолчанию предназначена для работы с часовым графиком из коробки, но другие таймфреймы и типы графиков, такие как ренко, диапазон, тики, также работают хорошо. Платформа и индикатор — ваши инструменты для экспериментов с целью найти подходящие настройки для вашей стратегии. Вот примеры быстрых пресетов, которые вы можете попробовать:
Быстрые пресеты для старта
Основные валюты Forex — готово к использованию
Настройки по умолчанию оптимизированы для основных валютных пар на таймфрейме H1. Изменения не требуются. Просто примените индикатор и установите уровень перекупленности на 25, а перепроданности на -25.
Золото и нефть — немного более отзывчивые
Для золота (XAU/USD) и сырой нефти увеличьте базовую отзывчивость до 0.10, чтобы лучше захватывать их характерные колебания момента. Немного расширьте уровни OB/OS до 30 и -30, чтобы учесть их более широкий диапазон колебаний. Все остальные настройки можно оставить по умолчанию.
Индексы акций — быстрее и точнее
Индексы, такие как US30, NAS100 и SPX500, выигрывают от более коротких периодов сглаживания. Установите быстрый период на 11 и медленный на 21 для более быстрой реакции на внутридневные изменения момента. Увеличьте базовую отзывчивость до 0.10 и уменьшите период сигнала до 6 для более точного времени пересечения. Оставьте OB на 25 и OS на -25. Минимальная конъюнкция 3 хорошо работает для большинства торговых индексов.
Криптовалюты — созданы для скорости
Рынки криптовалют движутся быстро и сильно трендируют. Укоротите быстрый период до 10 и медленный до 21. Повышайте базовую отзывчивость до 0.12 и уменьшите базовую инерцию до 0.8, чтобы фильтр быстро реагировал на волатильные колебания. Используйте период сигнала 5 для более быстрой детекции пересечений. Повышайте максимальную отзывчивость до 0.5, чтобы дать механизму адаптации больше пространства. Понижайте минимальную конъюнкцию до 2, так как тренды криптовалют обычно более направленные и менее шумные после установления. Установите OB на 30 и OS на -30.
Облигации и медленные инструменты — терпеливые и избирательные
Гособлигации, бунды и другие медленно движущиеся инструменты требуют более длинных периодов анализа и большего терпения. Увеличьте быстрый период до 18 и медленный до 34. Уменьшите базовую отзывчивость до 0.05 и увеличьте базовую инерцию до 1.5, чтобы фильтр не реагировал на незначительные колебания. Увеличьте период сигнала до 10 и период адаптации до 15. Повышайте минимальную конъюнкцию до 4, чтобы сигналы срабатывали только на самых сильных установках. Используйте более узкие уровни OB/OS 20 и -20, так как эти инструменты колеблются в более узком диапазоне.
Важные замечания
- Не перерисовывается: При включенной опции "Требовать подтвержденный бар" (по умолчанию) все сигналы стрелок пересечения основаны на закрытых барах и никогда не изменяются и не исчезают ретроспективно.
- Значения импульсной и сигнальной линий на текущем (незакрытом) баре обновляются в реальном времени — это стандартное поведение любого индикатора. Только сигналы стрелок контролируются настройкой подтвержденного бара.
- Фиксированные уровни OB/OS являются простыми эталонными линиями. В отличие от динамических уровней, они не адаптируются к изменяющимся рыночным условиям. Настраивайте их в зависимости от актива и таймфрейма, с которым вы торгуете.
- При переключении диапазона вывода с центрированного на сдвинутый не забудьте обновить уровни OB/OS соответственно (см. таблицу рекомендаций уровней выше).
- Производительность: На очень длинных графиках (50 000+ баров) рассмотрите возможность установки "Максимального количества баров для расчета" в 5000-10000.
Отказ от ответственности
Этот индикатор является инструментом технического анализа и не является финансовой консультацией. Прошлые результаты не гарантируют будущих. Всегда используйте правильное управление рисками и комбинируйте с другими видами анализа перед принятием торговых решений.
Сводка
Отзывы покупателей
5 | 50 % | |
4 | 50 % | |
3 | 0 % | |
2 | 0 % | |
1 | 0 % |


![Логотип продукта "[Stellar Strategies] MARSI Signal Plotter"](https://cdn.ctrader.com/image/webp/7b2b8da6-8f8e-4646-8d4a-4710c516c01e_25567)


