present
Registrati e ricevi uno sconto da $50 sul tuo primo acquisto
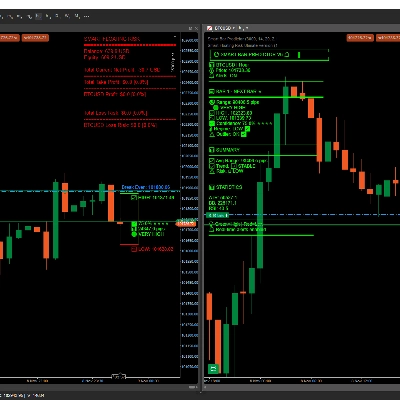
Trading product for FW Manual Volume Profile Indicatore Key Levels Volume, image 1
FW Manual Volume Profile
Indicatore
Versione 1.0, Nov 2026
Windows, Mac
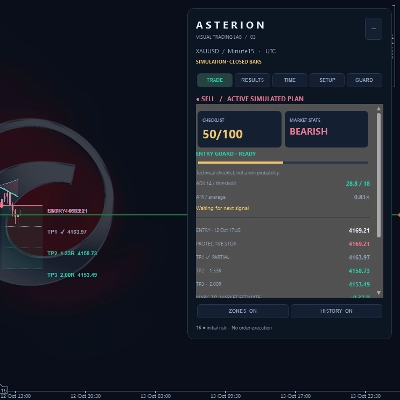
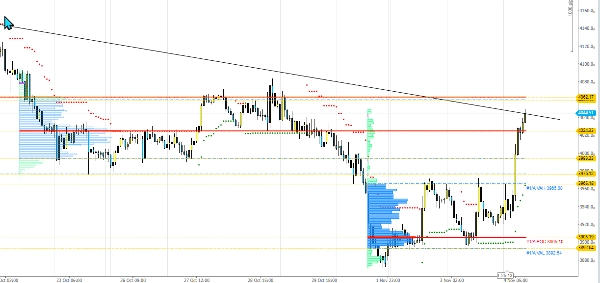
Trading product for FW Manual Volume Profile Indicatore Key Levels Volume, image 2
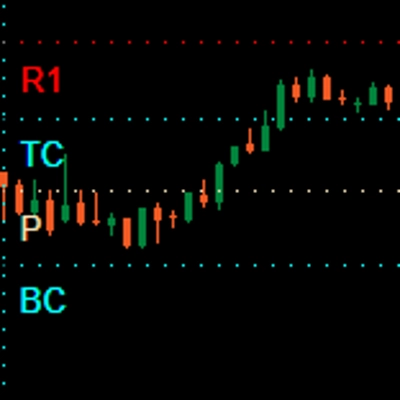
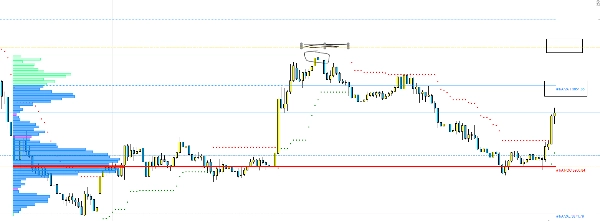
Trading product for FW Manual Volume Profile Indicatore Key Levels Volume, image 3
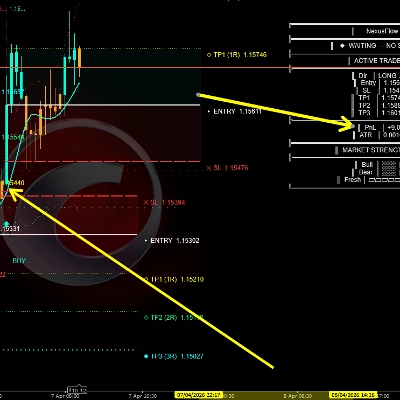
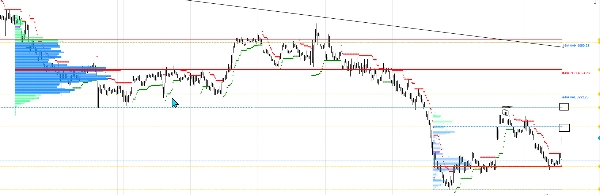
Trading product for FW Manual Volume Profile Indicatore Key Levels Volume, image 4
992.08M
Volume negoziato
1.32M
Profitto in pip
1
Vendite

Descrizione

FW Manual Volume Profile


Choose a time range and see where estimated tick volume is concentrated. This chart-overlay indicator for cTrader desktop displays a horizontal volume profile with Point of Control (POC), Value Area High (VAH) and Value Area Low (VAL).


WHAT THE LEVELS MEAN

POC is the price row with the highest estimated volume. VAH and VAL mark the boundaries of the selected Value Area, which defaults to 70%. These are analysis levels, not automatic buy or sell instructions.


MAIN FEATURES

• Draw multiple ranges manually, or use the shortcut for the last 100 completed chart bars.

• Choose fixed ranges or live ranges that extend with new data.

• Use four configurable templates with independent Value Area, row resolution, width and alignment.

• Adjust colours, transparency, labels, line styles and row spacing.

• Display optional local low-volume-node markers and TPO-based Single Print estimates.

• Save and restore profiles locally using cTrader storage.


DATA AND CALCULATION

The indicator uses broker-provided M1 candles and tick volume. Each minute's volume is distributed across that candle's high-low range as an estimate. It does not show actual exchange volume, order-book liquidity or aggressor-side bid/ask delta. Directional colours follow M1 candle direction. TPO annotations are estimates, not tick-by-tick time-at-price measurements.


History quality and availability affect the result. Gaps can reflect missing data or market closures. Live values can change while the current minute is forming. More rows and longer ranges increase processing requirements.


ALERTS AND MOBILE USE

Optional POC, VAH and VAL alerts use either desktop popup/sound or native cTrader price alerts. Messages are concise, for example “FW VP · POC · 123.45”. Touch/crossing behaviour, tolerance, cooldown and rearming distance/time are configurable.


The indicator and its custom chart drawings run on desktop; they are not displayed by cTrader Mobile or Web. Native alert appearance and mobile notifications are controlled by cTrader and the user's account/device settings. Desktop line colours are not transferred as custom mobile alert colours. Desktop popup alerts and automatic level updates require the indicator to remain running. Native alerts created by this instance are removed when the indicator is stopped or removed.


SETUP AND SUITABLE USE

Use cTrader desktop with Algo API 5.5 or newer and a time-based chart with sufficient M1 history. Designed for discretionary traders who understand POC, Value Area and the limitations of tick-volume estimates. Compare selected sessions or swings, inspect volume concentration and monitor chosen price levels. No specific account size or leverage is required: this indicator does not place orders.


Parameters and the chart toolbar use German labels. The main modes are “Fest” (fixed), “Live”, “PopupUndTon” (popup/sound) and “NativeKursalarme” (native price alerts). Profile storage is local; it does not synchronise profiles between devices. Use distinct storage identifiers for chart instances that should keep separate profiles.


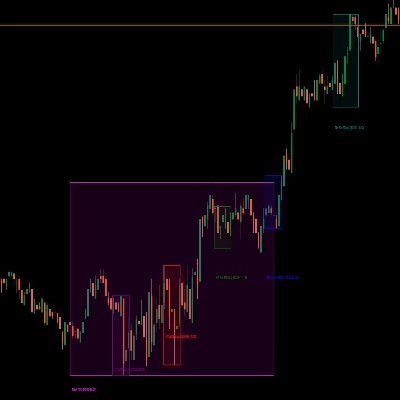
Version 0.8.5.4. The gallery uses chart examples from 3–4 November 2026 to illustrate the unchanged profile calculation. Red/green Supertrend dots, trend lines and hand-drawn annotations belong to separate tools and are not included. Interface details may differ between versions.


Trading involves risk. This is an analysis tool, not investment advice or a guarantee of trading results.

Riepilogo

Riepilogo AI
FW Manual Volume Profile is a cTrader desktop indicator that visualizes estimated tick volume distribution within user-defined time ranges. It overlays horizontal volume profiles on price charts, highlighting key levels: Point of Control (POC), the price with the highest volume; Value Area High (VAH); and Value Area Low (VAL), which define the volume concentration area (default 70%). Users can draw multiple manual ranges or apply a shortcut for the last 100 completed bars, selecting fixed or live ranges that update with new data.

The indicator supports four customizable templates with independent settings for Value Area, row resolution, width, and alignment. Visual elements such as colors, transparency, labels, line styles, and row spacing are adjustable. Additional features include optional markers for low-volume nodes and TPO-based Single Print estimates. Profiles can be saved and restored locally within cTrader.

Volume data is derived from broker-provided 1-minute candles and tick volume, distributing volume across each candle’s high-low range as an estimate. The tool does not use actual exchange volume or order book data. Alerts for POC, VAH, and VAL levels can be configured with desktop popups, sounds, or native cTrader price alerts, including customizable touch behavior and cooldown settings.

Designed for discretionary traders familiar with volume profile concepts, this indicator aids in analyzing volume concentration and key price levels but does not execute trades. It operates exclusively on cTrader desktop and requires sufficient M1 historical data.
Profilo indicatore
Categoria indicatore
Volume
Tipo di output
Visualizzazione
Segnali
Requisiti per i dati
Solo barre
Volume
Segnali supportati
Livello raggiunto
Livello rotto

Discussioni

Recensioni dei clienti

0.0
Recensioni: 0
Recensioni dei clienti
Questo prodotto non ha ancora ricevuto recensioni. L'hai già provato? Fallo sapere agli altri per primo!

Domande frequenti

Key Levels
Volume
I prodotti disponibili tramite cTrader Store, inclusi bot di trading, indicatori e plugin, sono forniti da sviluppatori terzi e resi disponibili esclusivamente a scopo informativo e di accesso tecnico. cTrader Store non è un broker e non fornisce consulenze in materia di investimento, raccomandazioni individualizzate o garanzie di risultati futuri.

Altro da questo autore

Logo di "FW_FIB"
Statistiche in tempo reale
A partire da $53
cBot
Fibonacci
Key Levels
+4
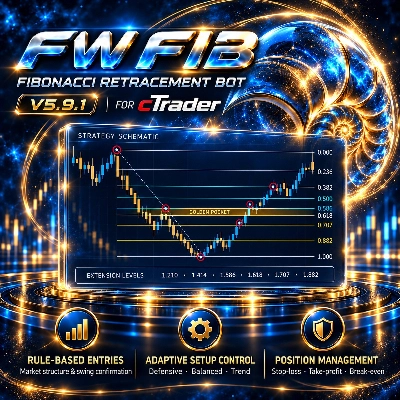
Rule-based Fibonacci cBot for cTrader with adaptive setups, automated entries, risk management and dedicated FW Next Lev
2.02
Fattore di profitto
cBot
Volume
Key Levels
+5
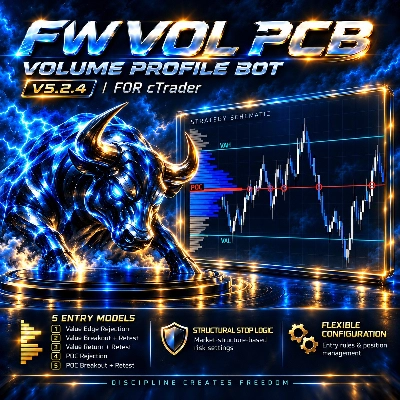
Rule-based Volume Profile cBot for cTrader with five entry models, POC/VAH/VAL analysis, automated risk management and d
2.21
Fattore di profitto

Potrebbe interessarti anche

Indicatore
SmartFibonacci — automatic Fibonacci retracements & extensions with swing detection, alerts and clean labels for cTrader
Indicatore
Pin Bar
Inducement
+5
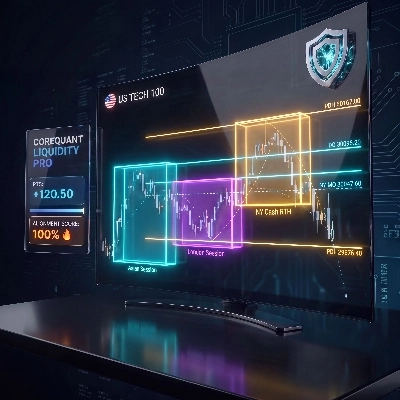
Institutional Nasdaq Session Liquidity Map with Live Point HUD, Sweep Alerts & Interactive Playbook.
Indicatore
ATR
RSI
+3
🚀 Specialized algorithm is designed to confirm entry and exit points with precision 🎯
Indicatore
Key Levels
Order Block
+2
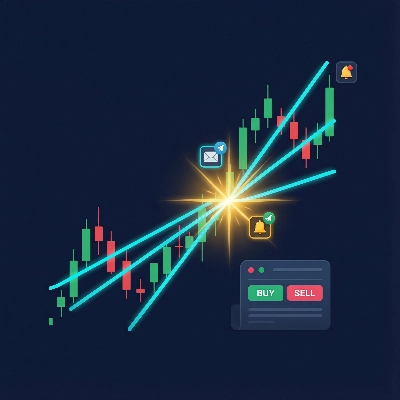
It monitors trend lines on price charts and fires multi-channel alerts and optionally places trades when price crosses..
Indicatore
AI
ATR
+27
🔮 Smart Bar Predictor - Professional Volatility Forecasting Indicator
Indicatore
ADX
ATR
+5
Configure, simulate, and analyze trading strategies with custom filters, multi-target exits, and detailed performance me
Indicatore
Prop
Forex
+4
Draws pivots (P, S/R, CPR) from selected anchors like H1–Month1, with optional mid-levels (PS1, S1S2, etc.)
Indicatore
Key Levels
Support & Resistance
Add your provider's gamma levels by hand or automatically with our feed plugin, and see the gamma regime at a glance.
Indicatore
ATR
Forex
+5
🚀 Buy and sell signals 📈📉 only when three independent engines agree simultaneously.
Indicatore
Support & Resistance
Detects Gartley, Bat, Butterfly, Crab, Shark & Cypher patterns and backtests each one's real win rate.
Indicatore
RSI
Prop
+14
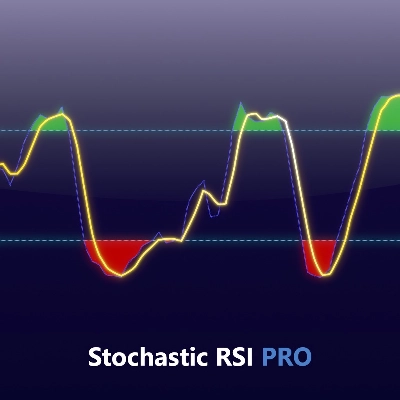
Unlock Stochastic RSI PRO in cTrader! Overlay RSI, highlight zones, and identify divergences with customizable settings.
Indicatore
Forex
Crypto
+2
PREMIUN INDICATOR
Indicatore
Forex
BTCUSD
+11
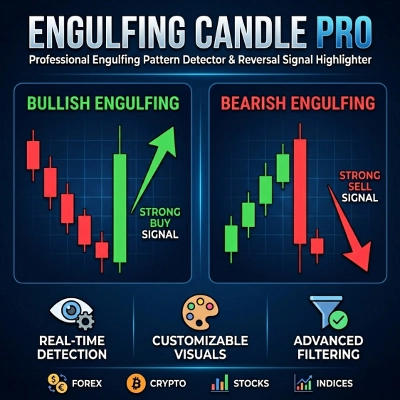
Auto-detects Bullish/Bearish Engulfing patterns to spot trend reversals. Real-time alerts, custom colors, all symbols.
Indicatore
Forex
BTCUSD
+5
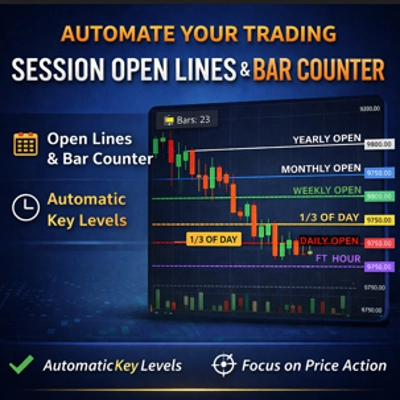
Auto-plots Open, High, and Low of Day/Week/Month/Year. Session candle counter + Round Numbers. Fully customizable
Indicatore
SMC
Prop
+8
KILLZONES AND MACRO SESSIONS
Indicatore
Supertrend
Moving Average
Adaptive MA anchored to structural trend changes — no fixed period. Dual Supertrend + swing detection.
Indicatore
SMC
Prop
+17
Unlock the true intent of market participants with the Classic Proportional Cumulative Volume Delta CVD!
Indicatore
XAUUSD
Commodities
A Fair Value Gap (FVG) indicator that identifies potential price imbalances, potential reversal and continuation zones

Prezzo

992.08M
Volume negoziato
1.32M
Profitto in pip
1
Vendite