present
Registrati e ricevi uno sconto da $50 sul tuo primo acquisto
Trading product for PulseFlow Imbalance Sessions and ADR Indicatore Fair Value Gap Key Levels, image 1
PulseFlow Imbalance Sessions and ADR
Indicatore
Versione 1.0, Oct 2026
Windows, Mac
Trading product for PulseFlow Imbalance Sessions and ADR Indicatore Fair Value Gap Key Levels, image 2
Trading product for PulseFlow Imbalance Sessions and ADR Indicatore Fair Value Gap Key Levels, image 3
Trading product for PulseFlow Imbalance Sessions and ADR Indicatore Fair Value Gap Key Levels, image 4
Da 14/10/2026

Descrizione

Launch price: $19 until November 14, 2026. After that date, the price returns to $33.

A clean chart, with nothing important hiding on the left


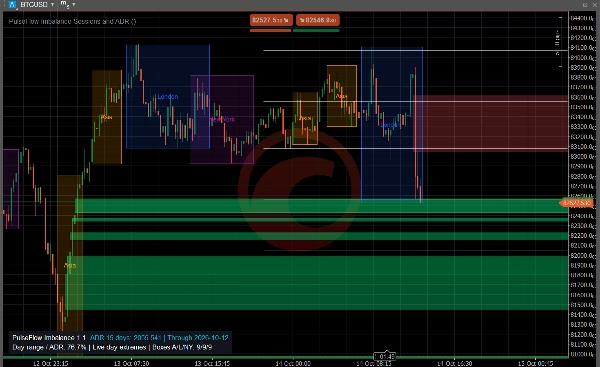
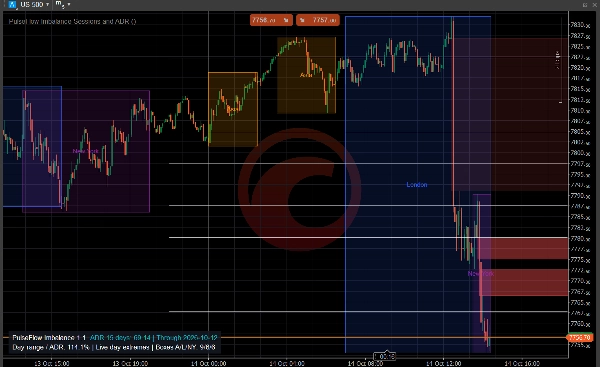
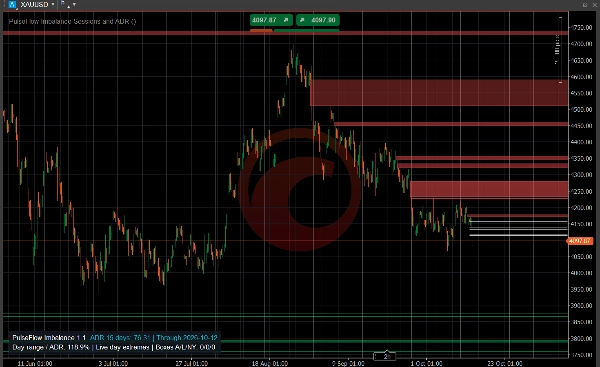
PulseFlow Imbalance Sessions and ADR keeps the structure that matters in front of you: open imbalance zones (fair value gaps), untouched session highs and lows, and how far the day has travelled against its average range. You read the chart at a glance, without dragging it back in time. It helps you make better decisions with clear references.


The zone you needed, lost to the left

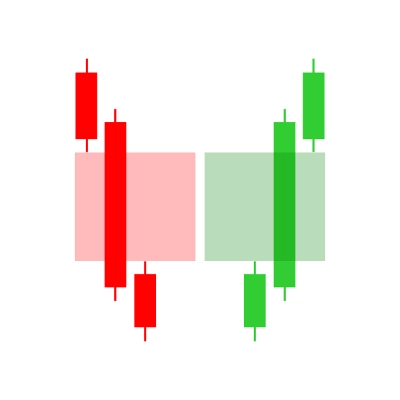
A fast move leaves an imbalance behind. By the time price comes back, it can be far off screen, and you wonder whether it was ever filled. Here, open zones stay in view until price fills them.


Only what is still open

- Bullish zones in green, bearish zones in red, extended to the right.

- Gaps that are small compared with the average daily range (ADR) are ignored, so only meaningful zones are drawn.

- A zone shrinks live as price trades back into it and disappears once it is completely filled.

- The shade of each zone shows the volume behind the move that created it: darker when volume was low, brighter when it was high. Volume comes from cTrader tick volume.


The map of the day

- Boxes mark the Asia (Tokyo), London and New York sessions, each in its own colour.

- Dotted lines stay at the high and low of each finished session until price touches them.

- ADR projections at 50%, 75% and 100% of the average daily range, measured from the day's low and high or from the day open, show how much room the day has used.

- A compact panel shows the current ADR and the share of it the day has already covered.


Then the reading is yours

Watch what price does when it returns to an open zone or a session level: pause, rejection or a full fill. Optional cTrader pop-up alerts tell you about new imbalances, large imbalances relative to the ADR, first touches, partial fills and complete fills, so you can step away from the screen.


Type, instruments and timeframes

Chart overlay indicator for market structure: imbalance zones, session levels and daily range projections. It works on any market with candles, such as stock indices, forex, gold and cryptocurrencies. Imbalance zones work on all standard time-based charts. Session boxes need an intraday chart and read best up to the 1-hour chart. ADR projections are available on intraday and daily charts. Tick, Renko, range and Heikin Ashi charts are not supported.


Keep in mind

Zones are drawn when the third candle closes, after the move, never ahead of it. Sessions are clock windows without a holiday calendar and can be switched off. The ADR is an average of completed days, not a limit price must respect. Zones and levels are references, not entries, stops or targets, and price may ignore any of them.


Trading involves risk. Past performance does not guarantee future results.

Riepilogo

Profilo indicatore
Categoria indicatore
Struttura del mercato (SMC)
Tipo di output
Visualizzazione
Requisiti per i dati
Solo barre
Segnali supportati
Livello raggiunto

Discussioni

Recensioni dei clienti

0.0
Recensioni: 0
Recensioni dei clienti
Questo prodotto non ha ancora ricevuto recensioni. L'hai già provato? Fallo sapere agli altri per primo!

Domande frequenti

Fair Value Gap
Key Levels
Imbalance
I prodotti disponibili tramite cTrader Store, inclusi bot di trading, indicatori e plugin, sono forniti da sviluppatori terzi e resi disponibili esclusivamente a scopo informativo e di accesso tecnico. cTrader Store non è un broker e non fornisce consulenze in materia di investimento, raccomandazioni individualizzate o garanzie di risultati futuri.

Altro da questo autore

Indicatore
RSI
Fibonacci
+1
Spot RSI divergences on your chart and get an entry, stop and six targets when your filters line up.
Indicatore
Key Levels
Market Structure
+1
See the day's percentage targets from the open, so you know where the session stands at a glance.
Indicatore
Key Levels
Support & Resistance
Add your provider's gamma levels by hand or automatically with our feed plugin, and see the gamma regime at a glance.
Plugin per desktop
External Data
HTTP Requests
Load live gamma levels from your own QuantWheel API key into PulseFlow Gamma Regime, with no more typing by hand.

Potrebbe interessarti anche

Logo di "rvwap v1"
Più votato
4.6
(5)
$19
Indicatore
Prop
VWAP
+13
Rolling VWAP with dynamic or fixed time window, customizable source price and standard deviation bands.
Indicatore
Signal
USDJPY
See USD demand in one line—Composite OBV fuses six major FX pairs into a clear momentum gauge.
Indicatore
AI
ATR
+23
The ZigZag Trend is a market structure tool that filters out small price fluctuations and highlights major swing.
Indicatore
ADX
ATR
+5
Configure, simulate, and analyze trading strategies with custom filters, multi-target exits, and detailed performance me
Indicatore
ATR
RSI
+14
A metric that can set 1 to 3 groups of Bollinger Bands
Indicatore
AI
ATR
+20
Algorithmic trend precision for cTrader.
Indicatore
The Advanced Volume Profile Indicator calculates POC, Median, and Mode, revealing key price levels for smarter trading.
Indicatore
AI
ATR
+19
QX SessionBox ORB: Session boxes + ORB levels + clean dashboard with optional closed-candle breakout signals.
Indicatore
VWAP
Support & Resistance
Trading.FC$_vwap Algo shows VWAP trends, dynamic support/resistance and deviation bands to spot potential trade entries.
Indicatore
BOS
EMA
+5
VWAP Bands indicator with 3 standard deviation levels, buy/sell zones, and a draggable ON/OFF button to toggle the entir
Indicatore
Forex
BTCUSD
+7
🚀 TMAX RBA Indicator - The Ultimate Multi-Timeframe Momentum System 🚀
Indicatore
Prop
VWAP
+5
Multi-anchor VWAP indicator for cTrader. Plots two VWAP lines (red and blue) with selectable anchors.
Indicatore
Prop
Forex
+4
The Smooth Heiken Ashi indicator is a refined charting tool designed to filter out market noise and highlight true price
Indicatore
ATR
RSI
+16
Highlight market consolidation zones instantly with this Inside Candle indicator — precise, clean, and powerful.
Indicatore
ATR
BOS
+5
Opening ranges, dynamic trend channels, and multi-scale breakout/retest analysis for clear intraday chart decisions.
Indicatore
Drawdown Monitor
Protect your funded account. Real-time Daily Equity Drawdown monitor with Green / Orange / Red flashing alerts.
Indicatore
XAUUSD
Commodities
A Fair Value Gap (FVG) indicator that identifies potential price imbalances, potential reversal and continuation zones
Indicatore
Signal
This Fair Value Gap (FVG) indicator is a technical analysis on multi-timeframe.

Prezzo

Da 14/10/2026