
คำอธิบาย
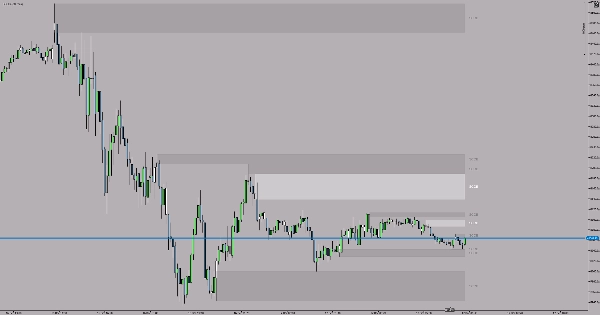
ตัวบ่งชี้ SCOB (Single Candle Order Block) จะระบุและเน้นรูปแบบบล็อกคำสั่งที่ทรงพลังบนแผนภูมิของคุณโดยอัตโนมัติ เครื่องมือที่เรียบง่ายแต่มีประสิทธิภาพนี้ช่วยให้นักเทรดสามารถมองเห็นรูปแบบกลับตัวสำคัญที่มักบ่งชี้ถึงกิจกรรมของสถาบันที่แข็งแกร่ง
SCOB คืออะไร?
SCOB คือรูปแบบแท่งเทียนสามแท่งที่แสดงถึงโซนกลับตัวที่เป็นไปได้:
Bullish SCOB:
- แท่งเทียนที่ 2 ทำจุดต่ำสุดต่ำกว่าแท่งเทียนที่ 3
- จุดต่ำสุดของแท่งเทียนที่ 1 อยู่เหนือจุดต่ำสุดของแท่งเทียนที่ 2
- แท่งเทียนที่ 1 ปิดเหนือจุดสูงสุดของแท่งเทียนที่ 2
- แท่งเทียนที่ 2 ถูกเน้น เป็นโซนแนวรับที่เป็นไปได้
Bearish SCOB:
- แท่งเทียนที่ 2 ทำจุดสูงสุดสูงกว่าแท่งเทียนที่ 3
- จุดสูงสุดของแท่งเทียนที่ 1 อยู่ต่ำกว่าจุดสูงสุดของแท่งเทียนที่ 2
- แท่งเทียนที่ 1 ปิดต่ำกว่าจุดต่ำสุดของแท่งเทียนที่ 2
- แท่งเทียนที่ 2 ถูกเน้น เป็นโซนแนวต้านที่เป็นไปได้
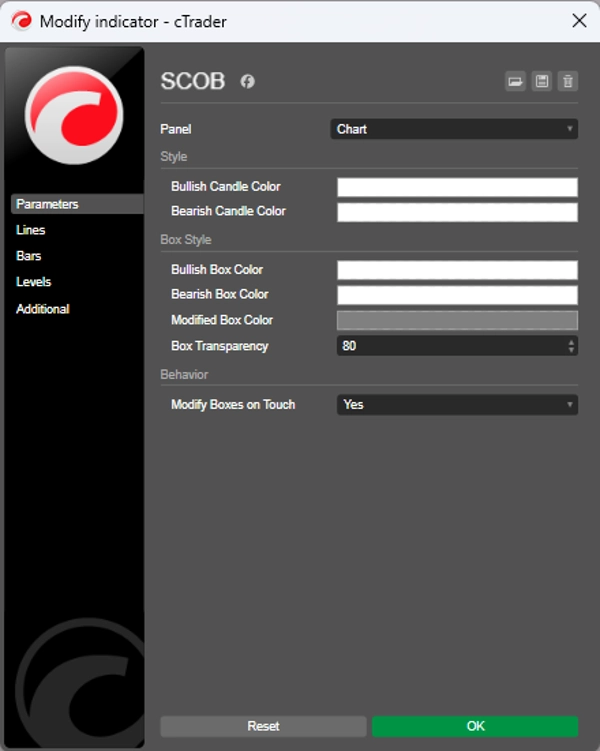
การตั้งค่า
สีแท่งเทียนขาขึ้น - เลือกสีเน้นสำหรับรูปแบบ SCOB ขาขึ้น (ค่าเริ่มต้น: สีขาว)
สีแท่งเทียนขาลง - เลือกสีเน้นสำหรับรูปแบบ SCOB ขาลง (ค่าเริ่มต้น: สีเหลือง)
เคล็ดลับการใช้งาน
- ใช้รูปแบบ SCOB เพื่อระบุโซนเข้าเทรดที่เป็นไปได้
- ผสมผสานกับเครื่องมือวิเคราะห์ทางเทคนิคอื่น ๆ เพื่อยืนยัน
- แท่งเทียนที่ถูกเน้นแสดงถึงระดับสถาบันที่สำคัญ
- เทรดตามแนวโน้มเสมอเพื่อการตั้งค่าที่มีโอกาสสำเร็จสูงขึ้น
- สามารถใช้ได้กับทุกกรอบเวลาตามกลยุทธ์การเทรดของคุณ
- แนวปฏิบัติที่ดีที่สุด: ทำเครื่องหมายรูปแบบ SCOB บนกรอบเวลาที่สูงขึ้น (H1, H4, Daily) และเทรดตามทิศทางของแนวโน้ม
สรุป
โปรไฟล์อินดิเคเตอร์
รีวิวจากลูกค้า
4.5
รีวิว: 2
5 | 50 % | |
4 | 50 % | |
3 | 0 % | |
2 | 0 % | |
1 | 0 % |
รีวิวจากลูกค้า
October 3, 2025
Helps more when the trader avoids forced trades. It should not replace the chart.
การสนทนา
คำถามที่พบบ่อย
BTCUSD
Forex
Indices
EURUSD
Commodities
GBPUSD
Prop
Scalping
SMC
Crypto
Stocks
XAUUSD
NAS100
USDJPY
ผลิตภัณฑ์ที่มีให้บริการผ่าน cTrader Store รวมถึงบอทการเทรด อินดิเคเตอร์ และปลั๊กอิน มีให้บริการโดยนักพัฒนาบุคคลที่สามและมีไว้เพื่อวัตถุประสงค์ในการเข้าถึงข้อมูลและทางเทคนิคเท่านั้น cTrader Store ไม่ใช่โบรกเกอร์และไม่ได้ให้คำแนะนำการลงทุน คำแนะนำส่วนบุคคล หรือการรับประกันผลการดำเนินงานในอนาคต


ราคา
ตั้งแต่ 05/01/2025
14
การขาย