

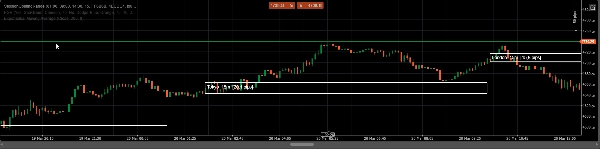
Trading product for SessionOpiningRange Indikator Prop Forex, image 1
Indikator
2 käufe
Version 1.0, Apr 2026
Windows, Mac
4.0
Bewertungen: 1
Trading product for SessionOpiningRange Indikator Prop Forex, image 2
Seit 07/10/2025
2
Verkäufe

Session Opening Range — Tokio · London · New York


Zeichnet automatisch die Opening Range für die drei wichtigsten Handelssitzungen direkt in Ihrem cTrader-Chart. Keine manuellen Zeichnungen, keine verpassten Levels — der Indikator berechnet und zeigt alles in Echtzeit an.


─────────────────────────────

HAUPTMERKMALE

─────────────────────────────


► Drei Sitzungen

Tokio, London und New York — jede Sitzung ist vollständig unabhängig mit eigener Startzeit, Farbe und Umschalter.


► Konfigurierbare Dauer der Opening Range

Legen Sie die Dauer der Range in Minuten fest (Standard: 15 Min.). Der Indikator markiert automatisch das Hoch und Tief der ersten N Minuten nach Sitzungsbeginn.


► Hoch- / Tief-Linien

Klare horizontale Linien am Hoch und Tief der Sitzung — die wichtigsten Levels für Ausbruchs- und Umkehr-Trades.


► Zonenfüllung

Optionale Hintergrundfüllung für die Opening Range Zone. Hilft Ihnen, die Range auf jedem Zeitrahmen sofort zu erkennen.


► Sitzungsbeschriftungen

Schalten Sie Beschriftungen direkt im Chart ein, um immer zu wissen, welche Sitzungszone Sie betrachten.


─────────────────────────────

STANDARD-SITZUNGSZEITEN (UTC+1)

─────────────────────────────


Tokio → 01:00

London → 09:00

New York → 14:30


Alle Startzeiten sind vollständig anpassbar, um mit der Zeitzone Ihres Brokers übereinzustimmen.


─────────────────────────────

ANLEITUNG

─────────────────────────────


1. Befestigen Sie den Indikator an einem beliebigen Chart und Zeitrahmen.

2. Stellen Sie Ihre Sitzungsstartzeiten so ein, dass sie mit der Serverzeit Ihres Brokers übereinstimmen (Standard: UTC+1).

3. Definieren Sie die Dauer der Opening Range in Minuten.

4. Aktivieren oder deaktivieren Sie bei Bedarf die Zonenfüllung und Beschriftungen.


Die Hoch- und Tief-Level der Sitzung sind Ihre wichtigsten Bezugspunkte für den Handelstag — verwenden Sie sie für Ausbruchseinstiege, Stop-Setzung und Liquiditätsziele.


─────────────────────────────

IDEAL FÜR

─────────────────────────────


✔ ICT / SMC-Trader, die mit Killzone-Konzepten arbeiten

✔ Opening Range Breakout (ORB)-Strategien

✔ Sitzungsbasierte Liquiditäts- und Manipulationsanalyse

✔ FTMO / Prop-Firm-Trader, die eine klare Sitzungsstruktur benötigen


─────────────────────────────

KOMPATIBILITÄT

─────────────────────────────


Plattform : cTrader (Windows & Mac)

Sprache : C# / cAlgo

Zeitrahmen: Alle (M1 bis W1)

Instrumente: Forex, Gold, Indizes, Krypto

Indikatorprofil
Indikatorkategorie
Marktstruktur (SMC)
Ausgabetyp
Visualisierung
Datenanforderungen
Nur Balken
Unterstützte Signale
Wendepunkt
Eröffnungsspanne der Sitzung
Ausbruch
4.0
Bewertungen: 1
5
0 %
4
100 %
3
0 %
2
0 %
1
0 %
Kundenbewertungen
April 16, 2026
Prop
Forex
Breakout
Indices
Commodities
SMC
Crypto
XAUUSD
Über den cTrader Store verfügbare Produkte, einschließlich Handelsbots, Indikatoren und Plugins, werden von externen Entwicklern bereitgestellt und nur zu Informations- und technischen Zugriffszwecken verfügbar gemacht. cTrader Store ist kein Broker und erbringt keine Anlageberatung, persönlichen Empfehlungen oder eine Garantie für zukünftige Performance.

Mehr von diesem Autor

Indikator
SMC
Prop
+12
Killzone, ICT, SMC, Session, Asia, London, New York, NY PM, Session High, Session Low, Smart Money, Order Flow, Trading
Indikator
SMC
Prop
+12
Shows bullish/bearish bias for 5 timeframes in one panel. Three bias methods, alignment summary, fully configurable.
Indikator
MSS
Key Levels
+4
Maps session ranges, previous highs/lows, equilibrium and premium/discount zones on your cTrader chart.
Indikator
Key Levels
Liquidity Grab
+3
Visual market context dashboard showing bias states, CE positioning, session status and sweep context.
Indikator
Liquidity Grab
Liquidity Sweep
+2
Visualizes accumulation ranges, manipulation sweeps and distribution phases on your cTrader chart.
Indikator
MSS
Key Levels
+2
Maps equal highs, equal lows and active liquidity pools directly on your cTrader chart.
Indikator
BOS
Key Levels
+2
Maps bullish and bearish order block zones, CE levels and structure-based price action context.
Indikator
BOS
MSS
+3
Maps BOS, CHoCH, swing breaks and market structure shifts directly on your cTrader chart.

Das könnte Sie auch noch interessieren

Indikator
Forex
cTrader Auto Support & Resistance detects key levels with Fibonacci analysis and sends real-time trading alerts.
Indikator
AI
SMC
+19
ZigZag Pro — Advanced swing detection with ATR threshold, fractal confirmation, and colored segments. Clean market
Indikator
Forex
BTCUSD
+10
🎯Smart Signals : Auto Buy/Sell alerts with dynamic TP/SL algorithm. 💡
Indikator
Supply & Demand
Support & Resistance
RAF Supply Demand Lite v1.0 automatically detects clean Supply and Demand zones using confirmed swing highs and lows. Zo
Indikator
XAUUSD
Commodities
A Fair Value Gap (FVG) indicator that identifies potential price imbalances, potential reversal and continuation zones
Indikator
Prop
VWAP
+15
VWAP: Follow the smart money. Trade with real volume and the fair price on your side!
Indikator
ATR
RSI
+5
Delta RSI Candle Pro, the indicator that transforms ordinary candlesticks into powerful momentum visualizers.
Indikator
This indicator is a valuable tool for traders looking to identify significant opening price level of any asset.
Indikator
Shows daily and sessions highs / lows and session boxes, everything configurable
Indikator
AI
ATR
+10
FX Sniper: Multi-pair Forex analysis tool. Features trend logic, adaptive pivots, and momentum filtering for major pairs
Indikator
Prop
Forex
+11
😎Read the description before purchasing💩
Indikator
Key Levels
Liquidity Grab
+3
Visual market context dashboard showing bias states, CE positioning, session status and sweep context.
Indikator
AI
SMC
+7
The ultimate tool for Price Action and ICT. High, Low and Mid levels for days, weeks Inc. NY Midnight and Custom Range.
Indikator
Aggressive
Supertrend
+5
Stop trading with tunnel vision! 🚫 The Heat Map Dashboard is an institutional-grade visual trading assistant
Indikator
RSI
Indicator Stochastic With RSI
Indikator
Liquidity Grab
Liquidity Sweep
+2
Visualizes accumulation ranges, manipulation sweeps and distribution phases on your cTrader chart.
Indikator
ATR
Volume
+1
The UT Bot identify potential trend reversals and momentum shifts.
Indikator
EMA
VWAP
+2
ORB Range Indicator maps the opening range and gives a practical session-breakout workflow with clear labels.
Seit 07/10/2025
2
Verkäufe

























