Session Power Model
Indikator
1 kÀufe
Version 1.0, Jul 2026
Windows, Mac
Trading product for Session Power Model Indikator Liquidity Sweep Market Structure, image 2
Trading product for Session Power Model Indikator Liquidity Sweep Market Structure, image 3
Trading product for Session Power Model Indikator Liquidity Sweep Market Structure, image 4
Trading product for Session Power Model Indikator Liquidity Sweep Market Structure, image 5
4
VerkÀufe

Beschreibung

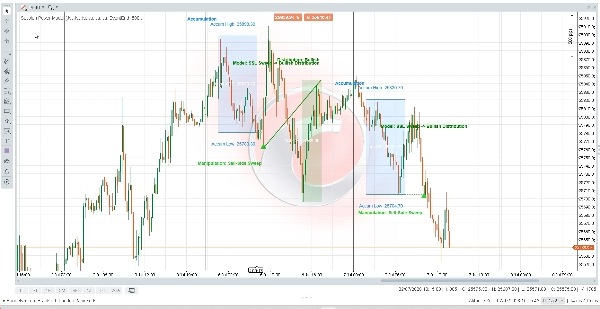
Session Power Model ist ein visueller cTrader-Indikator, der HĂ€ndlern hilft, wiederkehrendes Sitzungsverhalten direkt im Chart zu analysieren.


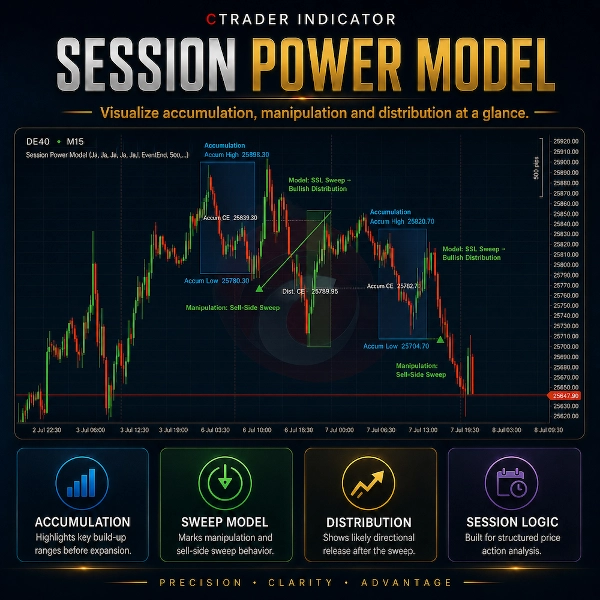
Der Indikator teilt den Handelstag in drei konfigurierbare Phasen: Akkumulation, Manipulation und Distribution. Er markiert den Akkumulationsbereich, erkennt potenzielle LiquiditĂ€ts-Sweeps wĂ€hrend des Manipulationsfensters und visualisiert die anschließende Distributionsphase.


Das Modell kann Sell-Side-Sweeps erkennen, die in einen bullischen Distributionskontext fĂŒhren, Buy-Side-Sweeps, die in einen bĂ€rischen Distributionskontext fĂŒhren, sowie gemischte Tage, an denen beide Seiten gesweept werden.


Hauptmerkmale:

- Visualisierung des Akkumulationsbereichs

- Erkennung von Manipulations-Sweeps

- Anzeige der bullischen und bÀrischen Distributionsphase

- Session-CE-Linien

- Sweep-Pfeile

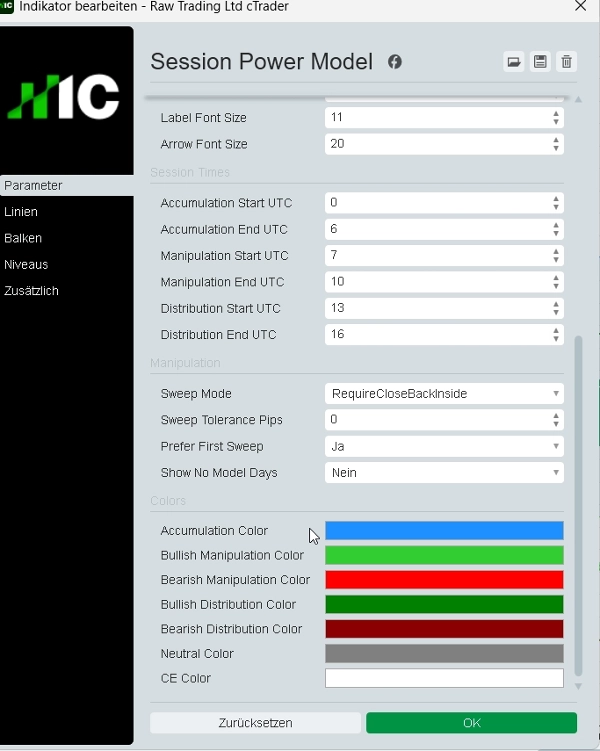
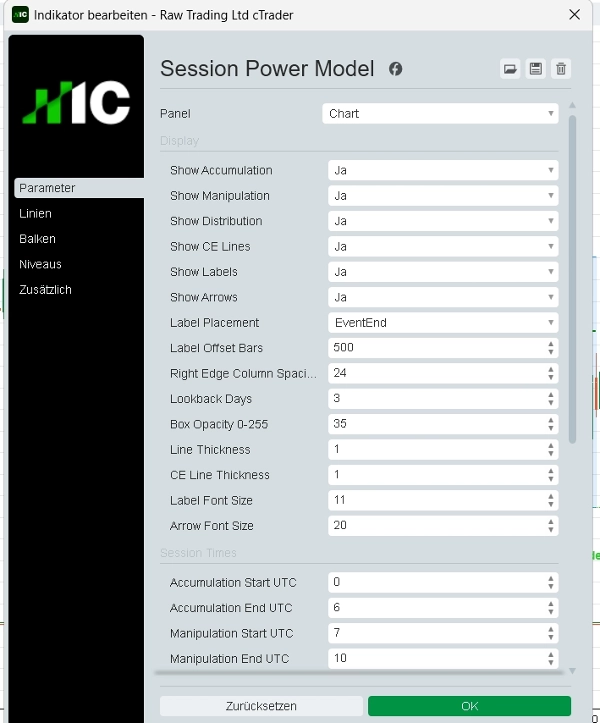
- Konfigurierbare Sitzungszeiten

- Einstellbare RĂŒckblick-Tage

- Platzierung von Labels am rechten Rand

- Saubere Chart-Überlagerung

- Benutzerdefinierte Farben, Transparenz und Label-Einstellungen

- Store-sicherer Indikator mit eingeschrÀnkten Zugriffsrechten


Session Power Model ist fĂŒr diskretionĂ€re Preisaktionsanalyse, liquiditĂ€tsbasierte ChartĂŒberprĂŒfung, Sitzungsforschung und Backtesting-Vorbereitung konzipiert.


Dieser Indikator ist kein Handelsroboter. Er fĂŒhrt keine Trades aus, Ă€ndert keine Orders und liefert keine garantierten Kauf-/Verkaufssignale. Er ist lediglich ein Chart-Visualisierungs- und Marktkontext-Tool.


Handel ist mit Risiken verbunden. Dieser Indikator bietet keine Finanzberatung, keine Anlageempfehlungen, keine statistischen Wahrscheinlichkeiten oder garantierte Handelsergebnisse.


Zusammenfassung

KI-Zusammenfassung
Session Power Model is a cTrader indicator that visually segments the trading day into three phases: accumulation, manipulation, and distribution. It highlights the accumulation range, detects liquidity sweeps during the manipulation phase, and displays bullish or bearish distribution phases on the chart. The indicator identifies sell-side sweeps leading to bullish distributions, buy-side sweeps leading to bearish distributions, and mixed scenarios involving both sides. Key features include configurable session times, adjustable lookback periods, session CE lines, sweep arrows, customizable colors and labels, and a clean chart overlay. Designed for discretionary price action analysis, liquidity-based chart review, session research, and backtesting preparation, this tool provides market context visualization without executing trades or offering trading signals. It supports analysis focused on market structure, liquidity sweeps, and support/resistance levels.
Indikatorprofil
Indikatorkategorie
Marktstruktur (SMC)
Ausgabetyp
Visualisierung
Datenanforderungen
Nur Balken
UnterstĂŒtzte Signale
Abweichung
Ausbruch
Wendepunkt
TrendstÀrke

Kundenbewertungen

0.0
Bewertungen: 0
Kundenbewertungen
Bisher gibt es keine Bewertungen fĂŒr dieses Produkt. Haben Sie es schon ausprobiert? Dann können Sie die erste Person sein, die andere darĂŒber informiert!

Diskussion

HĂ€ufig gestellte Fragen (FAQ)

Liquidity Sweep
Market Structure
Liquidity Grab
Support & Resistance
Über den cTrader Store verfĂŒgbare Produkte, einschließlich Handelsbots, Indikatoren und Plugins, werden von externen Entwicklern bereitgestellt und nur zu Informations- und technischen Zugriffszwecken verfĂŒgbar gemacht. cTrader Store ist kein Broker und erbringt keine Anlageberatung, persönlichen Empfehlungen oder eine Garantie fĂŒr zukĂŒnftige Performance.

Mehr von diesem Autor

Indikator
SMC
Prop
+6
Automatically draws the Opening Range (High & Low) for Tokyo, London, and New York sessions. Configurable start times,
Indikator
BOS
Key Levels
+2
Maps bullish and bearish order block zones, CE levels and structure-based price action context.
Indikator
SMC
Prop
+12
Shows bullish/bearish bias for 5 timeframes in one panel. Three bias methods, alignment summary, fully configurable.
Indikator
MSS
Key Levels
+4
Maps session ranges, previous highs/lows, equilibrium and premium/discount zones on your cTrader chart.
Indikator
Key Levels
Liquidity Grab
+3
Visual market context dashboard showing bias states, CE positioning, session status and sweep context.
Indikator
MSS
Key Levels
+2
Maps equal highs, equal lows and active liquidity pools directly on your cTrader chart.
Indikator
BOS
MSS
+3
Maps BOS, CHoCH, swing breaks and market structure shifts directly on your cTrader chart.
Indikator
EMA
RSI
+2
Compact premium cTrader dashboard for market bias, sessions, premium/discount context, liquidity direction, ADR range an
Indikator
SMC
Prop
+12
Killzone, ICT, SMC, Session, Asia, London, New York, NY PM, Session High, Session Low, Smart Money, Order Flow, Trading

Das könnte Sie auch noch interessieren

Indikator
AI
RSI
+19
The HAI Quantum V10 is an advanced indicator designed for technical analysis.
Indikator
SMA
Volume
+3
Quadruple Stochastic Alignment Indicator + Multiple Complementary Detections
Indikator
Forex
EURUSD
+4
This is a tool to help traders open orders/close orders/modify orders quickly with just one click.
Indikator
AI
ATR
+27
VWAP Sniper Elite -- Institutional Trend Engine
Indikator
Volume
Imbalance
+5
Professional OrderFlow Footprint Analysis ( Bid/ask, POC, VA, Delta, Absorption, Imbalance )
Indikator
AI
ATR
+18
Scalping signals with EMA/RSI/ATR logic. Visual cloud shows precise entry and exit zones. Built for M1/M5 scalpers.
Indikator
AI
Prop
+16
Pro trading dashboard: WVAP analysis + Volume Profile + Neural AI tracking + News alerts. All-in-one tool!
Indikator
Prop
Institution-level trend Analyzer.
Indikator
RSI
MACD
+5
An advanced indicator merging Smart Money Concepts, Gann Sq9 targets, Monte Carlo analysis, and MTF trend bias.
Indikator
EMA
Moving Average
+2
Trade the Trend. Ignore the Noise
Indikator
Volume
Key Levels
Money Flow Profile maps traded volume and market sentiment across price levels, revealing key liquidity zones and trends
Indikator
Prop
Forex
+15
Footprint volume indicator showing bid/ask splits at each price level
Indikator
ATR
RSI
+5
One of the best indicators we have ever developed, with a very high profit ratio.
Indikator
Forex
BTCUSD
+5
Cross EMA Pro – Trend Reversal Indicator
Indikator
ATR
RSI
+2
This indicator works best as a trend-confirmation tool—wait for multiple signals!
Indikator
Prop
Forex
+13
"Footprint Chart: Visualize bid-ask volume inside candles for clearer order flow and market depth insights."
Indikator
Volume
Imbalance
+2
FOOTPRINT PRO - Candles tell you where price moved
Indikator
ATR
Fibonacci
+4
Emperor Signals Pro is a premium non-repainting indicator for Forex pairs on the 15-minute timeframe

Preis

4
VerkÀufe