present
ลงทะเบียนและรับส่วนลด $50 สำหรับการซื้อครั้งแรกของคุณ
Trading product for Fixed Range Volume Profile - Manual อินดิเคเตอร์ Key Levels Volume, image 1
Fixed Range Volume Profile - Manual
อินดิเคเตอร์
เวอร์ชัน 1.0, Oct 2026
Windows, Mac
Trading product for Fixed Range Volume Profile - Manual อินดิเคเตอร์ Key Levels Volume, image 2
Trading product for Fixed Range Volume Profile - Manual อินดิเคเตอร์ Key Levels Volume, image 3
Trading product for Fixed Range Volume Profile - Manual อินดิเคเตอร์ Key Levels Volume, image 4
ตั้งแต่ 16/09/2026

คำอธิบาย

Fixed Range Volume Profile - Manual เป็นตัวบ่งชี้แผนภูมิ cTrader ที่จัดกลุ่มการสังเกต tick ตามราคาภายในช่วงเวลาที่เลือก รุ่นเต็มจะแสดงโปรไฟล์พร้อมกับ Point of Control (POC), Value Area High (VAH) และ Value Area Low (VAL)


เลือกช่วงเวลา


เพิ่มตัวบ่งชี้รุ่นเต็มลงในแผนภูมิ จากนั้นเลื่อนเส้นแนวตั้งเริ่มต้นและสิ้นสุดเพื่อเลือกช่วงเวลาที่คุณต้องการตรวจสอบ โปรไฟล์และระดับของมันจะคำนวณใหม่สำหรับช่วงเวลานั้น แผงแผนภูมิจะแสดงช่วงเวลาที่เลือก จำนวนการสังเกต tick ที่รวมอยู่ และราคาของ POC, VAH และ VAL


กำหนดค่าโปรไฟล์


- จำนวนแถว: 12–100 แถวราคา; ค่าเริ่มต้น 32

- เปอร์เซ็นต์พื้นที่ค่า: 50–95%; ค่าเริ่มต้น 70%


POC ระบุแถวราคาที่มีจำนวนการสังเกต tick มากที่สุด พื้นที่ค่าขยายจาก POC ไปยังแถวข้างเคียงเพื่อรวมส่วนแบ่งที่กำหนดของการสังเกตเหล่านั้น VAH และ VAL ระบุขอบเขตบนและล่างของพื้นที่ค่า


ทำความเข้าใจกับข้อมูล


แต่ละ tick ที่มีอยู่จะมีส่วนร่วมในการสังเกตหนึ่งครั้งที่จุดกึ่งกลางของราคาซื้อ (Bid) และขาย (Ask) นี่คือโปรไฟล์ของกิจกรรม tick ไม่ใช่ปริมาณการซื้อขายในตลาด, ปริมาณซื้อ/ขาย หรือเดลต้าโฟลว์คำสั่ง


ตัวบ่งชี้จะตรวจสอบ tick ที่มีอยู่ล่าสุดสูงสุด 100,000 tick และรวม tick เหล่านั้นที่อยู่ในช่วงเวลาที่เลือก ผลลัพธ์จึงขึ้นอยู่กับประวัติ tick ของโบรกเกอร์และข้อมูลที่โหลดใน cTrader การเลือกช่วงเวลาไม่ได้รับประกันว่ามีประวัติ tick ครบถ้วนสำหรับช่วงเวลานั้น


เริ่มต้นใช้งาน


1. ติดตั้งตัวบ่งชี้ที่ซื้อใน cTrader Desktop โดยใช้ cTrader ID เดียวกับที่ใช้ซื้อ เปิด Algo > Indicators เลือก Fixed Range Volume Profile - Manual และเพิ่มอินสแตนซ์สำหรับสัญลักษณ์และกรอบเวลาของคุณ คุณยังสามารถแนบผ่านตัวเลือกตัวบ่งชี้แผนภูมิได้

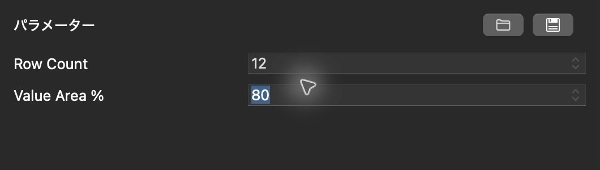
2. ในแผง Parameters ของอินสแตนซ์ ตั้งค่า Row Count และ Value Area % หรือใช้ค่าเริ่มต้น Row Count จะเปลี่ยนความละเอียดของบรรทัดราคา; Value Area % จะเปลี่ยนส่วนแบ่งของการสังเกต tick ที่ใช้สำหรับพื้นที่ค่า

3. เลือกและลากเส้นแนวตั้งเริ่มต้นและสิ้นสุดของตัวบ่งชี้เพื่อเลือกช่วงเวลา ตรวจสอบวันที่ช่วงเวลาที่แสดงในแผงด้านบนขวาหลังจากเลื่อนขอบเขต

4. อ่านโปรไฟล์, POC, VAH และ VAL พร้อมกับช่วงเวลาที่เลือกและจำนวน tick ในแผงแผนภูมิ


ตัวบ่งชี้เป็นเครื่องมือวิเคราะห์ ไม่ได้วางหรือจัดการการซื้อขายและไม่ทำนายปฏิกิริยาราคาที่ระดับที่แสดง


การอ่านภาพหน้าจอ


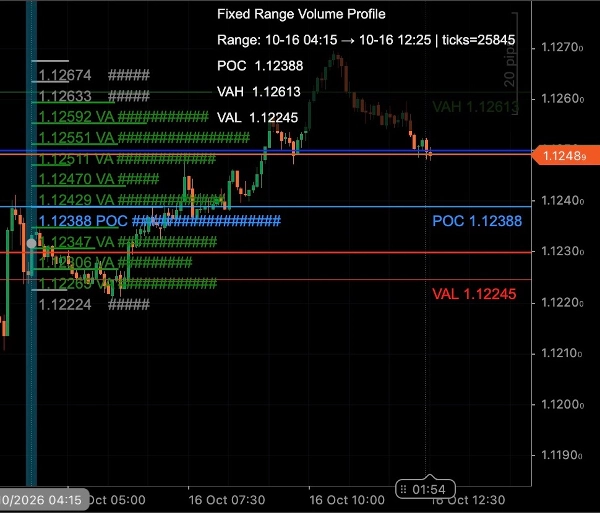
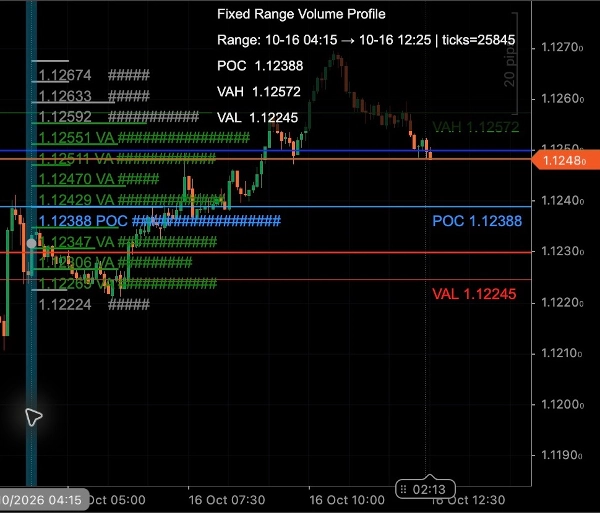
แผนภูมิพื้นที่ค่า 70% แสดงช่วงเวลาที่เลือกและโปรไฟล์กิจกรรม tick แนวนอนที่พื้นที่ค่า 70% แผนภูมิพื้นที่ค่า 80% แสดง POC, VAH และ VAL พร้อมพื้นที่ค่า 80% สีน้ำเงินระบุ POC สีเขียวระบุแถวพื้นที่ค่าและ VAH และสีแดงระบุ VAL แถวสีเทาอยู่นอกพื้นที่ค่า ภาพการตั้งค่าจะแสดงตัวควบคุม Row Count และ Value Area % จริง ตั้งค่าเป็น 12 และ 80 สำหรับตัวอย่าง 80% เหล่านี้เป็นการตั้งค่าตัวอย่าง ไม่ใช่ค่าเริ่มต้น แผนภูมิยังมีแท่งเทียนราคาปกติและเครื่องหมายราคาปัจจุบัน; ตัวบ่งชี้ไม่สร้างสัญญาณซื้อขาย


ข้อจำกัด


กิจกรรม tick อธิบายการอัปเดตราคาที่โบรกเกอร์จัดหาให้ ไม่ใช่ปริมาณสัญญาหรือหุ้นที่ซื้อขาย โบรกเกอร์และประวัติที่มีอยู่ต่างกันอาจสร้างโปรไฟล์ที่แตกต่างกัน ประวัติที่เก่าหรือไม่มีอาจทำให้ช่วงเวลาที่เลือกไม่สมบูรณ์ ระดับที่แสดงอธิบายการสังเกตที่เลือกและไม่ได้รับประกันว่าเป็นแนวรับ แนวต้าน หรือราคาที่จะเกิดขึ้น ไม่มีการทดลองใช้งานแยกต่างหากใน Store


สรุป

AI summary
Fixed Range Volume Profile - Manual is a cTrader chart indicator that visualizes tick activity grouped by price within a user-selected time range. It displays a volume profile highlighting the Point of Control (POC)—the price level with the highest tick count—along with the Value Area High (VAH) and Value Area Low (VAL), which define the upper and lower boundaries of the value area containing a configurable percentage of tick observations.

Users add the indicator to a chart and adjust start and end vertical lines to select the analysis period. The profile recalculates dynamically for the chosen range, showing the number of tick observations and key levels in the chart panel. Configuration options include setting the number of price rows (12 to 100) and the value area percentage (50% to 95%), affecting the profile’s resolution and value area size.

The indicator uses tick data representing quote updates at the midpoint between bid and ask prices, not actual traded volume or order flow. It processes up to 100,000 recent ticks depending on broker data availability. This tool provides visual insight into price-level activity but does not generate trade signals or manage orders.

โปรไฟล์อินดิเคเตอร์
หมวดหมู่อินดิเคเตอร์
ปริมาณ
ประเภทเอาต์พุต
การแสดงเป็นภาพ
ข้อกำหนดด้านข้อมูล
ข้อมูล Tick

รีวิวจากลูกค้า

0.0
รีวิว: 0
รีวิวจากลูกค้า
ยังไม่มีรีวิวสำหรับผลิตภัณฑ์นี้ หากเคยลองแล้ว ขอเชิญมาเป็นคนแรกที่บอกคนอื่น!

การสนทนา

คำถามที่พบบ่อย

Key Levels
Volume
ผลิตภัณฑ์ที่มีให้บริการผ่าน cTrader Store รวมถึงบอทการเทรด อินดิเคเตอร์ และปลั๊กอิน มีให้บริการโดยนักพัฒนาบุคคลที่สามและมีไว้เพื่อวัตถุประสงค์ในการเข้าถึงข้อมูลและทางเทคนิคเท่านั้น cTrader Store ไม่ใช่โบรกเกอร์และไม่ได้ให้คำแนะนำการลงทุน คำแนะนำส่วนบุคคล หรือการรับประกันผลการดำเนินงานในอนาคต

เพิ่มเติมจากผู้เขียนคนนี้

อินดิเคเตอร์
BOS
MSS
+4
See confirmed BOS, CHOCH and SWEEP structure events on your cTrader chart.
อินดิเคเตอร์
BOS
Add standard-timeframe context candles to a native Renko chart.
อินดิเคเตอร์
EMA
Volume
Map range high, mid, low, price location and a deterministic pressure proxy on your cTrader chart.
อินดิเคเตอร์
Channel
Key Levels
+1
Monitor a selected chart trendline and confirm breaks on candle close.
ปลั๊กอินเดสก์ท็อป
Trade Journal
Trade Statistics
See not only what you made or lost, but which trading behaviours caused the damage.
ปลั๊กอินเดสก์ท็อป
Chart UI Tools
Keep lines, zones and channels synced across selected same-symbol charts from one desktop plugin.
cBot
Drawdown Guard
Daily Loss Limit
Monitor account-wide loss and stop-loss risk budgets, with optional order cancellation and post-fill closure.
ปลั๊กอินเดสก์ท็อป
Position Sizer
Risk Calculator
Size manual trades from your risk settings and review Market, Limit or Stop orders before execution.

นอกจากนี้คุณยังอาจชอบ

อินดิเคเตอร์
AI
SMC
+18
ICT HTF Candles- The Ultimate Multi-Timeframe Dashboard Stop switching timeframes and losing focus.
อินดิเคเตอร์
Prop
Forex
+5
Pivot Point with base zone daily Asia-London-New york Session.
"[Hamster-Coder] Bollinger Bands" โลโก้
เรตติ้งสูง
4.5
(4)
$19
/
$20
อินดิเคเตอร์
Signal
Breakout
+1
Bolliger Bands + Hamster-Coder™ Timeframe Decoupling
อินดิเคเตอร์
Prop
Forex
+11
Ultimate Session Tool: Boxes, OR, KZs, PD Levels, Overlaps, Custom Lines & Names, Info Panel! Highly customizable 📉📈
"TMAX RBA 2026 ULTRA" โลโก้
ยอดนิยม
4.5
(6)
$20
/
$25
อินดิเคเตอร์
Forex
BTCUSD
+7
🚀 TMAX RBA Indicator - The Ultimate Multi-Timeframe Momentum System 🚀
อินดิเคเตอร์
ADX
ATR
+5
EMA-cross signals scored on six confluence layers, with an ATR stop, three targets and a live panel
อินดิเคเตอร์
ATR
RSI
+5
Multi-factor VWAP mean-reversion signals with ATR bands, volume exhaustion, and RSI gate on cTrader.
"CVD" โลโก้
ยอดนิยม
4.6
(3)
$20
/
$30
อินดิเคเตอร์
Signal
Cumulative Volume Delta tracks the net difference in tick volume between buying and selling pressure over time
"MARainbow" โลโก้
เรตติ้งสูง
4.2
(4)
$19
/
$38
อินดิเคเตอร์
Forex
Crypto
+3
MARainbow gives you the edge with four customizable moving averages—each color-coded for instant recognition.
อินดิเคเตอร์
Doji
Volume
+5
Instantly spot high-liquidity institutional moves with clean, non-obtrusive triangle alerts on cTrader charts.
อินดิเคเตอร์
Prop
VWAP
+5
VWAP is a powerful tool for intraday traders
อินดิเคเตอร์
Risk Dashboard
AI-powered daily range forecasts help traders spot volatility opportunities and plan stops and targets.
อินดิเคเตอร์
Volume
Liquidity Sweep
+1
Liquidity Profiler Tools
อินดิเคเตอร์
ATR
RSI
+4
RSI bands drawn on price, confluence-scored BUY/SELL signals, an ATR stop with three targets
อินดิเคเตอร์
The Weekly Daily Levels indicator shows the OHLC, and mid-point prices for the previous day and week.
อินดิเคเตอร์
Forex
Crypto
+4
Pro Heikin Ashi Visual Overlay – Clean Trend Visualization
อินดิเคเตอร์
BOS
Volume
+5
The Volume Delta Indicator using Institutional Level 2 DOM Data, The Edge Institutions Pay Millions For, now on cTrader
อินดิเคเตอร์
EMA
Volume
Map range high, mid, low, price location and a deterministic pressure proxy on your cTrader chart.

ราคา

ตั้งแต่ 16/09/2026