present
ลงทะเบียนและรับส่วนลด $50 สำหรับการซื้อครั้งแรกของคุณ
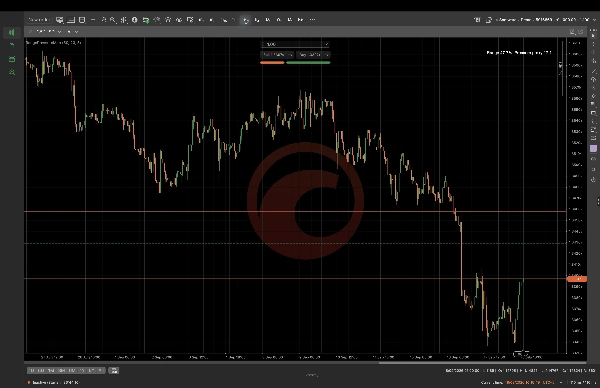
Trading product for Range Pressure Map อินดิเคเตอร์ EMA Volume, image 1
Range Pressure Map
อินดิเคเตอร์
เวอร์ชัน 1.0, Sep 2026
Windows, Mac
Trading product for Range Pressure Map อินดิเคเตอร์ EMA Volume, image 2
Trading product for Range Pressure Map อินดิเคเตอร์ EMA Volume, image 3
Trading product for Range Pressure Map อินดิเคเตอร์ EMA Volume, image 4
Trading product for Range Pressure Map อินดิเคเตอร์ EMA Volume, image 5
ตั้งแต่ 16/09/2026

คำอธิบาย

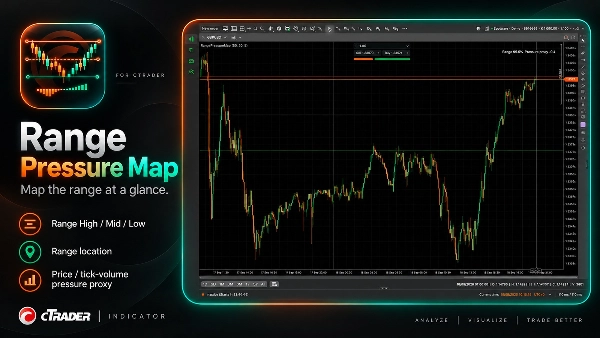
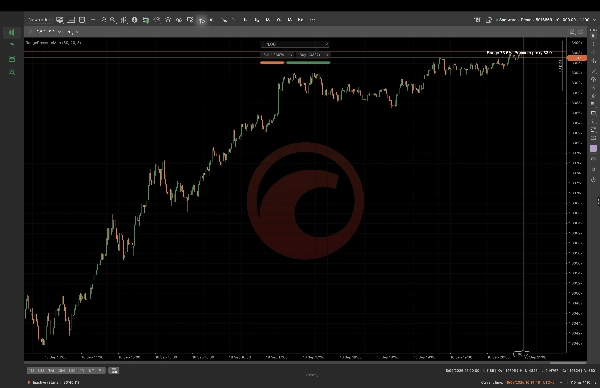
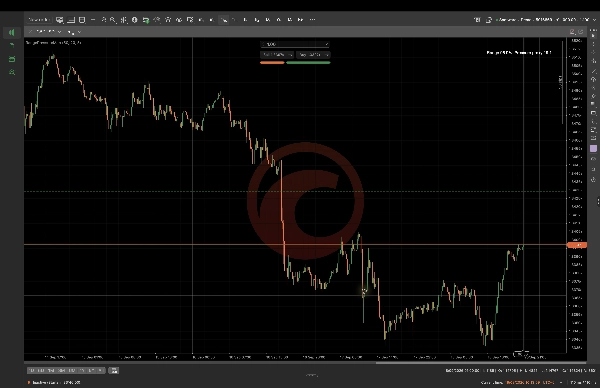
แผนที่แรงดันช่วงคำนวณช่วงเวลาย้อนหลังและแสดงช่วงสูง ช่วงกลาง และช่วงต่ำพร้อมกับตำแหน่งราคาปัจจุบันและตัวแทนแรงดันปริมาณการเคลื่อนไหวแบบกำหนดได้ ปรับแต่งช่วงเวลาย้อนหลัง แรงดันย้อนกลับ และความยาว EMA ให้ตรงกับบริบทของแผนภูมิที่คุณกำลังตรวจสอบ ออกแบบมาเพื่อการวิเคราะห์แผนภูมิแบบเลือกสรรและไม่ได้แสดงถึงการไหลของคำสั่ง ปริมาณตลาดจริง กิจกรรมของผู้ซื้อหรือผู้ขาย การทำนาย หรือการดำเนินการซื้อขายอัตโนมัติ ค่าจะขึ้นอยู่กับสัญลักษณ์ที่เลือก ช่วงเวลา พารามิเตอร์ และข้อมูลที่มีอยู่

สรุป

AI summary
Range Pressure Map is a cTrader indicator that calculates a lookback range and visually displays the Range High, Range Mid, and Range Low levels on your chart. It also shows the current price location within this range alongside a deterministic tick-volume pressure proxy, which serves as an estimate of market pressure based on tick volume data. Users can customize parameters including range lookback period, pressure lookback, and EMA length to align with their specific chart context. This tool is intended for discretionary chart analysis and does not provide order flow data, real market volume, buyer or seller activity, predictive signals, or automated trade execution. Its outputs depend on the selected trading symbol, timeframe, and input parameters. The indicator supports visualization of support and resistance levels combined with volume-based pressure insights to assist traders in analyzing price action within defined ranges.
โปรไฟล์อินดิเคเตอร์
หมวดหมู่อินดิเคเตอร์
แนวรับและแนวต้าน
ประเภทเอาต์พุต
การแสดงเป็นภาพ
ข้อกำหนดด้านข้อมูล
แท่งเท่านั้น

รีวิวจากลูกค้า

0.0
รีวิว: 0
รีวิวจากลูกค้า
ยังไม่มีรีวิวสำหรับผลิตภัณฑ์นี้ หากเคยลองแล้ว ขอเชิญมาเป็นคนแรกที่บอกคนอื่น!

การสนทนา

คำถามที่พบบ่อย

EMA
Volume
ผลิตภัณฑ์ที่มีให้บริการผ่าน cTrader Store รวมถึงบอทการเทรด อินดิเคเตอร์ และปลั๊กอิน มีให้บริการโดยนักพัฒนาบุคคลที่สามและมีไว้เพื่อวัตถุประสงค์ในการเข้าถึงข้อมูลและทางเทคนิคเท่านั้น cTrader Store ไม่ใช่โบรกเกอร์และไม่ได้ให้คำแนะนำการลงทุน คำแนะนำส่วนบุคคล หรือการรับประกันผลการดำเนินงานในอนาคต

เพิ่มเติมจากผู้เขียนคนนี้

อินดิเคเตอร์
BOS
MSS
+4
See confirmed BOS, CHOCH and SWEEP structure events on your cTrader chart.
อินดิเคเตอร์
BOS
Add standard-timeframe context candles to a native Renko chart.
อินดิเคเตอร์
Channel
Key Levels
+1
Monitor a selected chart trendline and confirm breaks on candle close.
ปลั๊กอินเดสก์ท็อป
Trade Journal
Trade Statistics
See not only what you made or lost, but which trading behaviours caused the damage.
ปลั๊กอินเดสก์ท็อป
Chart UI Tools
Keep lines, zones and channels synced across selected same-symbol charts from one desktop plugin.

นอกจากนี้คุณยังอาจชอบ

อินดิเคเตอร์
Forex
BTCUSD
+5
Daily/Weekly/Monthly - Highs & Lows Indicator (Customizable Settings)
อินดิเคเตอร์
Imbalance
Fair Value Gap
+1
Multi-symbol, multi-timeframe Fair Value Gaps in one panel.
"RSI + EMA Crossover Signals" โลโก้
ยอดนิยม
4.0
(2)
$49
อินดิเคเตอร์
ATR
RSI
+5
Dual confirmation RSI + EMA crossover signals with visual alerts and dynamic ATR offsets.
อินดิเคเตอร์
ATR
RSI
+4
Adaptive Ichimoku with nine-factor confluence scoring, five signal types, smart TP/SL and an MTF panel.
"EMA MTF Trend Pro" โลโก้
ยอดนิยม
4.0
(2)
$39
/
$60
อินดิเคเตอร์
AI
RSI
+7
EMA MTF TREND PRO - Multi-timeframe trend analysis overlay indicator, 6 timeframes - in one table with ADX
อินดิเคเตอร์
RSI
RSI on the main chart with 45/55 momentum levels, overbought/oversold levels, averaged RSI, and multi-timeframe support.
"Advanced Swings" โลโก้
ยอดนิยม
4.6
(3)
$49
อินดิเคเตอร์
Forex
Crypto
+3
ICT Advanced Swings Indicator – Multi-Timeframe Precision
อินดิเคเตอร์
SMC
Prop
+13
Perfect for traders who demand a clear overview of multiple timeframes at a glance.
อินดิเคเตอร์
ATR
EMA
+4
The FULL-MARKET-VIEW-DASHBOARD is a professional-grade trading suite for cTrader that eliminates market noise.
อินดิเคเตอร์
BOS
MSS
+4
See confirmed BOS, CHOCH and SWEEP structure events on your cTrader chart.
อินดิเคเตอร์
Forex
BTCUSD
+11
Master trends with Smart ADX: MTF Scanner, precise Buy/Sell signals, Divergence & clear Exit targets 🎯
อินดิเคเตอร์
ATR
Volume
+3
Fibonacci trend signals on closed bars, with an ATR stop, up to four targets and a break-even ladder.
อินดิเคเตอร์
Prop
Forex
+13
🐠 Coral Filter X Pro turns trend detection into a simple, repeatable workflow 🐠
อินดิเคเตอร์
ADX
ATR
+5
Range-filter BUY/SELL flips with an ATR or swing stop, three targets, five confluence stars and a live panel
อินดิเคเตอร์
EMA
Forex
+5
ALMA Smoothed Gaussian Moving Average (ASGMA) – by LudwigICT
"VA Footprint" โลโก้
เรตติ้งสูง
4.5
(4)
จาก $19
อินดิเคเตอร์
SMC
Prop
+5
VA Footprint replaces your chart with a order flow one, the most precise way to read the market.
"SMC + FVG Binary Signal Pro" โลโก้
เรตติ้งสูง
4.0
(4)
$29
/
$49
อินดิเคเตอร์
ATR
RSI
+20
SMC/ICT signals using FVG + liquidity sweep/MSS with EMA-RSI-MACD filters, clear visuals, and actionable alerts.
อินดิเคเตอร์
SMC
Prop
+9
PDL/PDH/PWL/PWH and Session higs/lows (customizable)

ราคา

ตั้งแต่ 16/09/2026