
คำอธิบาย
แผนที่ความสัมพันธ์ – เครื่องมือสำคัญสำหรับข้อมูลเชิงลึกของตลาดของคุณ
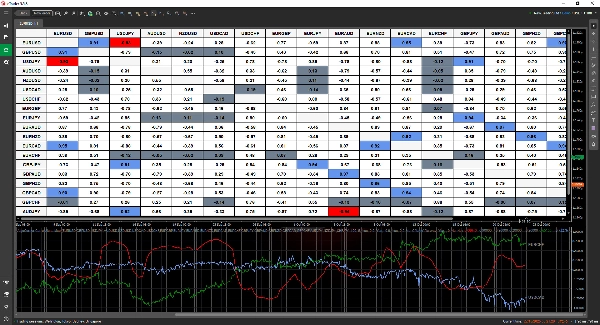
แผนที่ ความสัมพันธ์ เป็นตัวบ่งชี้ที่ทรงพลังและใช้งานง่าย ออกแบบมาเพื่อช่วยให้คุณค้นหาความสัมพันธ์ระหว่างสินทรัพย์ได้อย่างรวดเร็ว ด้วยรูปแบบตารางที่อ่านง่าย คุณสามารถสังเกตความสัมพันธ์และตัดสินใจซื้อขายได้อย่างมีข้อมูลมากขึ้น
✅ ปรับแต่งการวิเคราะห์ของคุณ – เลือกและเปรียบเทียบคู่การซื้อขายได้มากเท่าที่แพลตฟอร์มของคุณอนุญาต
✅ ช่วงเวลาที่ยืดหยุ่น – วิเคราะห์ความสัมพันธ์ในช่วงเวลาใดก็ได้ให้ตรงกับกลยุทธ์ของคุณ
✅ การแสดงผลที่ชัดเจนและปรับเปลี่ยนได้ – เลือกระหว่างรูปแบบทศนิยม (-1 ถึง 1) หรือเปอร์เซ็นต์ (-100% ถึง 100%)
✅ การเน้นอัจฉริยะ – ระบุความสัมพันธ์ที่แข็งแกร่งและอ่อนแอได้ง่ายด้วยการใช้สีที่ปรับแต่งได้
✅ การแจ้งเตือนแบบเรียลไทม์ – อยู่เหนือกว่าด้วยการแจ้งเตือนเมื่อค่าความสัมพันธ์เปลี่ยนแปลงอย่างมีนัยสำคัญ
✅ ข้อมูลแบบโต้ตอบ – คลิกที่เซลล์ใดก็ได้เพื่อติดตามการเปลี่ยนแปลงของความสัมพันธ์ตามเวลา
✅ การปรับปรุงอย่างต่อเนื่อง – เพลิดเพลินกับการอัปเดตในอนาคตโดยไม่มีค่าใช้จ่ายเพิ่มเติม
ค้นพบความสัมพันธ์สำคัญของตลาดและปรับกลยุทธ์การซื้อขายของคุณด้วยแผนที่ความสัมพันธ์! 🚀
สรุป
Key features include customizable display options with correlation values shown in decimal (-1 to 1) or percentage (-100% to 100%) formats, and smart color-coded highlighting to quickly identify strong or weak correlations. Users can interact with the data by clicking on any cell to track how correlations evolve over time. Real-time alerts notify users of significant changes in correlation values, aiding timely decision-making.
This tool is intended to help traders uncover relationships between assets efficiently, supporting more informed market analysis and strategy refinement.
รีวิวจากลูกค้า
5 | 67 % | |
4 | 33 % | |
3 | 0 % | |
2 | 0 % | |
1 | 0 % |


