
AlgoCorner Crosshair Edge
อินดิเคเตอร์
เวอร์ชัน 1.0, Apr 2025
Windows, Mac
5.0
รีวิว: 1
คำอธิบาย
Crosshair Edge: เครื่องมือแสดงข้อมูล cTrader ที่ดีที่สุด
ด้วย Crosshair Edge เครื่องมือที่มีประสิทธิภาพซึ่งช่วยปรับปรุงการแสดงผลข้อมูลตลาดภายในแพลตฟอร์ม cTrader คุณสามารถยกระดับการวิเคราะห์กราฟของคุณไปสู่ระดับใหม่
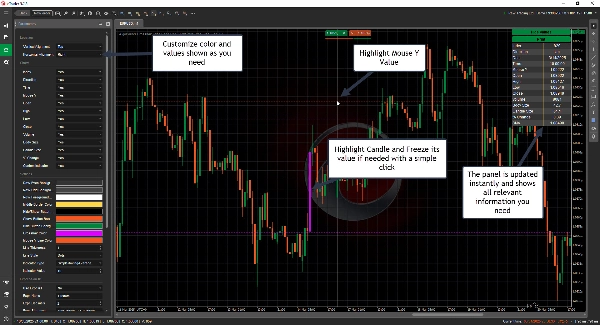
การโต้ตอบกับกราฟที่ดีขึ้น
- เน้นแถบปัจจุบันและช่วงของมัน
- ล็อก crosshair บนแท่งเทียนเฉพาะด้วยการคลิก และปลดล็อกอีกครั้งด้วยการคลิกเมื่อจำเป็น
- ส่งค่าต่าง ๆ ไปยังบันทึกของคุณเพื่อให้ง่ายต่อการคัดลอก
- แสดงหรือซ่อนเลย์เอาต์ตามที่ต้องการ
การปรับแต่งเต็มรูปแบบ
- ปรับแต่งสีให้เข้ากับสไตล์ของคุณ
- ปรับ crosshair ไปยังตำแหน่งใดก็ได้ที่คุณต้องการภายในกราฟ
- เลือกค่าที่จะแสดงและค่าที่ควรละเว้น
แสดงข้อมูลแท่งเทียนทันที
เพียงแค่เลื่อนเมาส์ไปที่แท่งเทียนใดก็ได้เพื่อดูรายละเอียดทั้งหมดและอื่น ๆ
- ดัชนี
- ทิศทาง
- วันที่
- เวลา
- ราคาที่เมาส์ชี้บนแกน Y
- เปิด
- สูงสุด
- ต่ำสุด
- ปิด
- ปริมาณ
- ขนาดตัวแท่ง
- ขนาดแท่งเทียน
- % การเปลี่ยนแปลง
- ค่าตัวบ่งชี้หลายค่า
-
- ADX
- ATR
- Chaikin Money Flow
- EMA, HMA, SMA, TSMA, TMA, WMA
- On Balance Volume
- RSI
- STD
- Weighted Close
- Welles Wilder Smoothing
- Williams %R
- วาดเส้นแนวนอน/แนวตั้งด้วยปุ่มลัดง่าย ๆ
-
- วาดเส้นแนวนอน: Ctrl + 1
- วาดเส้นแนวตั้ง: Ctrl + 2
- ปุ่มลัดปรับแต่งได้เต็มที่
- สูตรที่ปรับแต่งได้
-
- ใช้ Open, High, Low, Close และ Index เพื่อคำนวณสูตรที่เหมาะกับความต้องการของคุณ
- ตัวอย่าง ราคาทั่วไป: (High[index] + Low[index] + Close[index])/3.0
การรวมเข้ากับระบบอย่างราบรื่น
- ใบอนุญาตเชื่อมโยงกับ cTrader ID ของคุณเพื่อความสะดวกในการใช้งาน
- รวมการอัปเดตในอนาคต
ยกระดับประสบการณ์การเทรดของคุณด้วย Crosshair Edge วันนี้! 🚀
สรุป
โปรไฟล์อินดิเคเตอร์
รีวิวจากลูกค้า
5.0
รีวิว: 1
5 | 100 % | |
4 | 0 % | |
3 | 0 % | |
2 | 0 % | |
1 | 0 % |
รีวิวจากลูกค้า
การสนทนา
คำถามที่พบบ่อย
Indices
RSI
ATR
ผลิตภัณฑ์ที่มีให้บริการผ่าน cTrader Store รวมถึงบอทการเทรด อินดิเคเตอร์ และปลั๊กอิน มีให้บริการโดยนักพัฒนาบุคคลที่สามและมีไว้เพื่อวัตถุประสงค์ในการเข้าถึงข้อมูลและทางเทคนิคเท่านั้น cTrader Store ไม่ใช่โบรกเกอร์และไม่ได้ให้คำแนะนำการลงทุน คำแนะนำส่วนบุคคล หรือการรับประกันผลการดำเนินงานในอนาคต


ราคา
10
การขาย
346
ติดตั้งฟรี