
คำอธิบาย
Supertrend Scanner คือเครื่องมือที่ดีที่สุดสำหรับการติดตามแนวโน้ม!
Supertrend Scanner เป็นวิธีที่ดีที่สุดในการนำหน้าตลาดเพราะช่วยให้คุณติดตามแนวโน้มในสินทรัพย์ต่าง ๆ แบบเรียลไทม์
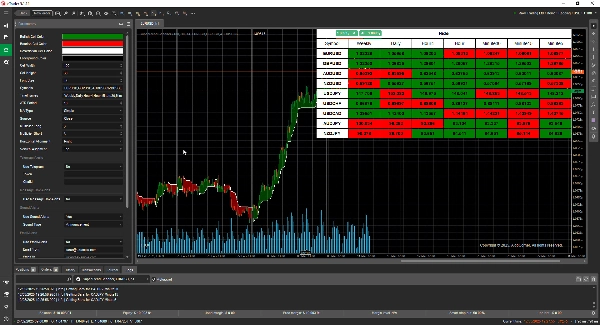
ตัวบ่งชี้ขั้นสูงนี้แสดง Supertrend หลายกรอบเวลาในมุมมองเดียวที่อ่านง่าย เพื่อให้คุณสามารถติดตามวัตถุมากกว่าหนึ่งรายการพร้อมกันได้
ไม่พลาดสัญญาณ: การแจ้งเตือนหลายประเภท!
การแจ้งเตือนที่ปรับแต่งได้ช่วยให้คุณทราบทันทีเมื่อแนวโน้มเปลี่ยนทิศทาง:
การแจ้งเตือนด้วยเสียงช่วยให้คุณรู้ว่าเกิดอะไรขึ้นโดยไม่ต้องมองที่หน้าจอ
ด้วยการแจ้งเตือนผ่าน Telegram คุณจะได้รับการอัปเดตบนโทรศัพท์ของคุณทันที
💬 การแจ้งเตือนกล่องข้อความ: เป็นการแจ้งเตือนป๊อปอัปทันทีในซอฟต์แวร์การซื้อขายของคุณ
📧 การแจ้งเตือนทางอีเมล – รับการแจ้งเตือนตรงไปยังกล่องจดหมายของคุณ
🏍 คุณสมบัติหลัก: ✠ รายการเฝ้าดูที่คุณสามารถปรับแต่งได้—เลือกสัญลักษณ์และวันที่ที่มีประโยชน์ที่สุดเพื่อให้แผงของคุณชัดเจนและตรงจุด
✠ การนำทางด้วยคลิกเดียว: โดยการคลิกที่เซลล์ใดก็ได้ คุณสามารถสลับระหว่างช่วงเวลาและสัญลักษณ์ได้อย่างรวดเร็ว
✅ ใช้งานง่าย—สไตล์ที่ชัดเจนและขับเคลื่อนด้วยข้อมูลหมายความว่าคุณไม่ต้องเลื่อนดูหลายชาร์ต
✠ การตัดสินใจที่ดีขึ้น: ค้นหาการเปลี่ยนแปลงแนวโน้ม การยืนยัน และการเบรกได้เร็วขึ้นในหลายเครื่องมือ
เหมาะสำหรับใคร? เทรดเดอร์สวิงและตำแหน่งสามารถติดตามแนวโน้มระยะยาวได้อย่างง่ายดาย
▪ เทรดเดอร์รายวันและสแคลเปอร์ – ติดตามการเปลี่ยนแปลงในตลาดของผลิตภัณฑ์ต่าง ๆ ได้
อย่าพลาดแนวโน้มอีกต่อไป!
ด้วย Supertrend Scanner คุณสามารถควบคุมการเทรดของคุณ เครื่องมือนี้มอบความได้เปรียบในตลาดที่ดีที่สุดไม่ว่าคุณจะมองหาการเบรก การกลับตัว หรือการยืนยันแนวโน้ม
🔥 รับเลยตอนนี้และเทรดด้วยความมั่นใจ!
สรุป
The scanner provides various alert types to notify users immediately when trend directions change, including sound alerts, Telegram notifications, instant pop-up message box alerts within the trading platform, and email alerts. These customizable alerts help traders stay informed without constant screen monitoring.
Supertrend Scanner is suitable for swing and position traders focusing on long-term trends, as well as day traders and scalpers who need to track rapid market changes across diverse products. Its clear, data-driven design facilitates faster identification of trend changes, confirmations, and breaks, supporting more informed trading decisions.
รีวิวจากลูกค้า
5 | 50 % | |
4 | 50 % | |
3 | 0 % | |
2 | 0 % | |
1 | 0 % |


