
AlgoCorner Crosshair Edge
Indicatore
Versione 1.0, Apr 2025
Windows, Mac
5.0
Recensioni: 1
Descrizione
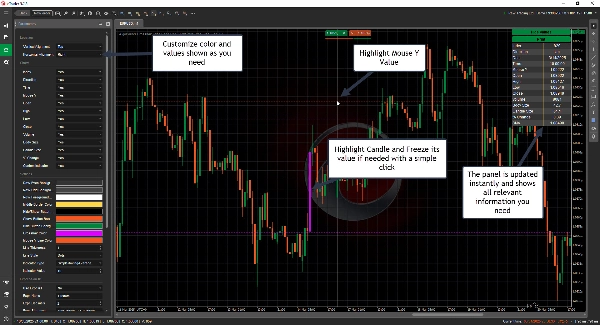
Crosshair Edge: Il miglior strumento di visualizzazione dati per cTrader
Con Crosshair Edge, uno strumento robusto che migliora la visualizzazione dei dati di mercato all'interno della piattaforma cTrader, puoi elevare la tua analisi dei grafici a nuovi livelli.
Interazione migliorata con il grafico
- Evidenzia la barra corrente e il suo intervallo
- Blocca il mirino su una candela specifica con un clic, e sbloccalo nuovamente con un clic quando necessario
- Invia i valori al tuo registro in modo che possano essere facilmente copiati
- Mostra o nascondi il layout secondo necessità
Personalizzazione completa
- Personalizza i colori secondo il tuo stile
- Regola il mirino in qualsiasi posizione tu abbia bisogno all'interno del grafico
- Seleziona quali valori visualizzare e quali omettere
Visualizzazione istantanea dei dati della candela
Passa semplicemente il mouse su qualsiasi candela per controllare tutti i suoi dettagli e altro ancora
- Indice
- Direzione
- Data
- Ora
- Prezzo Y del mouse
- Apertura
- Massimo
- Minimo
- Chiusura
- Volume
- Dimensione del corpo
- Dimensione della candela
- % Variazione
- Valori di più indicatori
-
- ADX
- ATR
- Chaikin Money Flow
- EMA, HMA, SMA, TSMA, TMA, WMA
- On Balance Volume
- RSI
- STD
- Chiusura ponderata
- Smussatura di Welles Wilder
- Williams %R
- Disegna linee orizzontali/verticali con semplici tasti di scelta rapida
-
- Disegna linea orizzontale: Ctrl + 1
- Disegna linea verticale: Ctrl + 2
- Tasti di scelta rapida completamente personalizzabili
- Formule personalizzabili
-
- Usa Apertura, Massimo, Minimo, Chiusura e Indice per calcolare formule che soddisfano le tue esigenze
- Esempio, Prezzo Tipico: (Massimo[indice] + Minimo[indice] + Chiusura[indice])/3.0
Integrazione senza soluzione di continuità
- Licenza collegata al tuo ID cTrader per facilità d'uso
- Aggiornamenti futuri inclusi
Migliora oggi la tua esperienza di trading con Crosshair Edge! 🚀
Riepilogo
Profilo indicatore
Recensioni dei clienti
5.0
Recensioni: 1
5 | 100 % | |
4 | 0 % | |
3 | 0 % | |
2 | 0 % | |
1 | 0 % |
Recensioni dei clienti
Discussioni
Domande frequenti
Indices
RSI
ATR
I prodotti disponibili tramite cTrader Store, inclusi bot di trading, indicatori e plugin, sono forniti da sviluppatori terzi e resi disponibili esclusivamente a scopo informativo e di accesso tecnico. cTrader Store non è un broker e non fornisce consulenze in materia di investimento, raccomandazioni individualizzate o garanzie di risultati futuri.


Prezzo
10
Vendite
347
Installazioni gratuite