
AlgoCorner McGinley Dynamic
อินดิเคเตอร์
60 ดาวน์โหลด
เวอร์ชัน 1.1, Jan 2026
Windows, Mac
คำอธิบาย
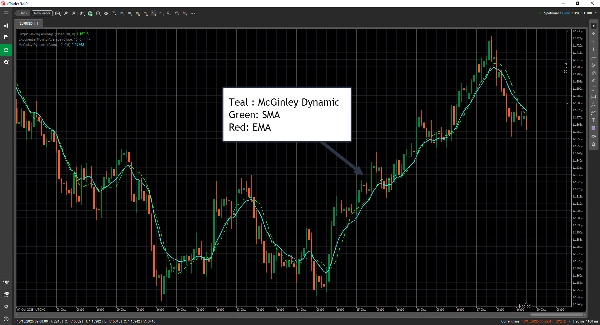
McGinley Dynamic เป็นหนึ่งในเครื่องมือทางเทคนิคที่ถูกประเมินค่าต่ำซึ่งจริงๆ แล้วมาจากการ สังเกตการณ์ที่ใช้งานได้จริง เกี่ยวกับค่าเฉลี่ยเคลื่อนที่
มันถูกสร้างขึ้นโดย John R. McGinley, CMT และจุดประสงค์หลักของมันคือ แก้ไขปัญหาทั่วไปของค่าเฉลี่ยเคลื่อนที่แบบดั้งเดิม — ได้แก่ ความล่าช้า และ การแกว่งตัวผิดพลาด ที่เกิดจากความผันผวนของความเร็วตลาด
นี่คือสิ่งที่มันพยายาม แก้ไขโดยเฉพาะ:
🧩 1. ความล่าช้าในค่าเฉลี่ยเคลื่อนที่
- ค่าเฉลี่ยเคลื่อนที่ปกติ (SMA, EMA) ล่าช้ากว่าราคาจริงเพราะพวกมันอิงตามช่วงเวลาที่กำหนดไว้ล่วงหน้า
- McGinley Dynamic จะ ปรับการทำให้เรียบโดยอัตโนมัติตามความเร็วของตลาด.
เมื่อตลาดเคลื่อนที่อย่างรวดเร็ว มันจะเร่งการปรับตัว; เมื่อตลาดช้าลง มันจะทำให้เรียบอย่างนุ่มนวลมากขึ้น
👉 ผลลัพธ์: มัน ติดตามราคาคล่องตัวมากขึ้น โดยไม่ตอบสนองเกินไป
🌪️ 2. การแกว่งตัวผิดพลาดในช่วงเวลาที่ผันผวน
- ค่าเฉลี่ยเคลื่อนที่แบบดั้งเดิมอาจให้สัญญาณผิดพลาดในตลาดที่ผันผวน
- McGinley แนะนำ ตัวส่วนแบบไดนามิก ที่ปรับตามอัตราความเร็วของตลาด
ซึ่งช่วยลดเสียงรบกวนและ หลีกเลี่ยงสัญญาณการตัดกันที่ไม่จำเป็น.
⚙️ 3. พฤติกรรมที่เรียบเนียนและแก้ไขตัวเองได้
- มันทำงานเหมือน ค่าเฉลี่ยเคลื่อนที่ที่ปรับตัวเองได้อัตโนมัติ หมายความว่าคุณไม่จำเป็นต้องปรับช่วงเวลามากนัก
- สิ่งนี้ทำให้มันไวต่อการป้อนข้อมูลของผู้ใช้และความผันผวนของตลาดน้อยลง — คล้ายกับค่าเฉลี่ยเคลื่อนที่ “อัจฉริยะ”
สรุป
สรุปโดย AI
AlgoCorner McGinley Dynamic is a technical indicator designed to improve upon traditional moving averages by reducing lag and false signals. Created by John R. McGinley, CMT, it automatically adjusts its smoothing based on market speed, allowing it to track price movements more closely without overreacting. The indicator employs a dynamic denominator that changes in proportion to market velocity, helping to minimize whipsaws and avoid unnecessary crossover signals during volatile or choppy market conditions. Acting as a self-correcting, auto-adjusting moving average, it requires less fine-tuning of parameters and is less sensitive to market volatility and user input. This makes it a practical tool for traders seeking a smoother, more responsive moving average that adapts naturally to changing market dynamics. It is applicable to Forex markets, including currency pairs such as EURUSD and GBPUSD.
โปรไฟล์อินดิเคเตอร์
รีวิวจากลูกค้า
0.0
รีวิว: 0
รีวิวจากลูกค้า
ยังไม่มีรีวิวสำหรับผลิตภัณฑ์นี้ หากเคยลองแล้ว ขอเชิญมาเป็นคนแรกที่บอกคนอื่น!
การสนทนา
คำถามที่พบบ่อย
Forex
EURUSD
GBPUSD
ผลิตภัณฑ์ที่มีให้บริการผ่าน cTrader Store รวมถึงบอทการเทรด อินดิเคเตอร์ และปลั๊กอิน มีให้บริการโดยนักพัฒนาบุคคลที่สามและมีไว้เพื่อวัตถุประสงค์ในการเข้าถึงข้อมูลและทางเทคนิคเท่านั้น cTrader Store ไม่ใช่โบรกเกอร์และไม่ได้ให้คำแนะนำการลงทุน คำแนะนำส่วนบุคคล หรือการรับประกันผลการดำเนินงานในอนาคต


ราคา
10
การขาย
351
ติดตั้งฟรี