설명
RSI NextGen Advanced
RSI NextGen은 고전적인 상대강도지수(RSI)의 진보되고 현대화된 버전입니다. 이는 다양한 시장 상황에서 보다 유연하고 적응력 있는 모멘텀 판독값을 제공하기 위해 설계된 추가 기능을 도입합니다. 고정 기간을 사용하는 전통적인 RSI와 달리, RSI NextGen은 시장 활동에 따라 동적으로 조정됩니다.
지표 작동 방식
RSI NextGen은 여러 적응 요인을 사용하여 값을 계산합니다:
변동성(ATR 기반) – 계산 기간은 시장 변동성에 따라 조정됩니다. 높은 변동성은 잘못된 신호를 줄이기 위해 기간을 확장하고, 낮은 변동성은 작은 움직임을 감지하기 위해 기간을 단축합니다.
거래량 – 높은 거래량으로 지지되는 가격 움직임은 더 큰 가중치를 가지며, 낮은 거래량의 움직임은 영향력이 적습니다.
가격 속도(모멘텀 / 가속도) – 빠른 가격 변화가 계산에 영향을 미쳐 지표가 급격한 시장 움직임을 더 잘 반영할 수 있도록 합니다.
델타 필터링 – 원시 RSI와 부드럽게 처리된 버전을 비교하여 노이즈를 줄입니다.
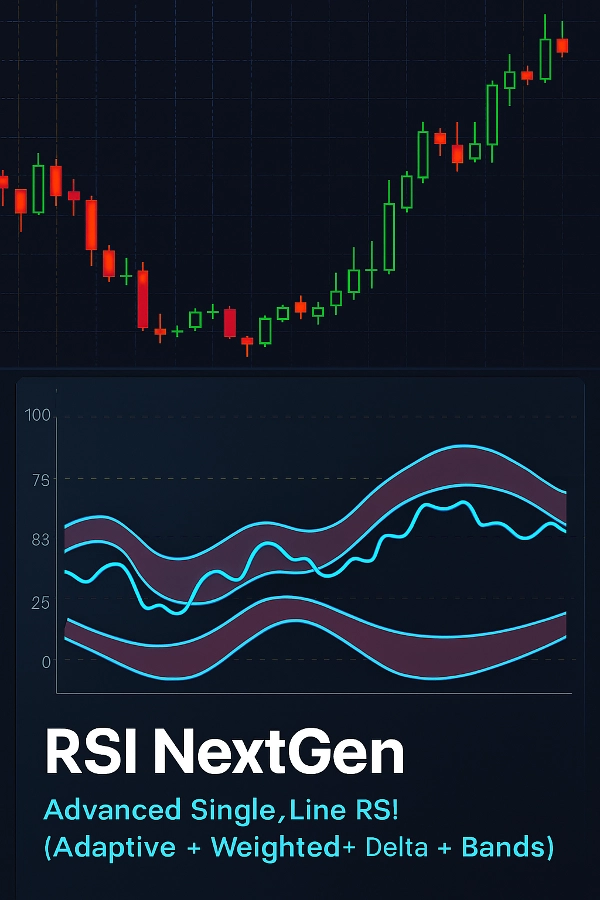
동적 밴드 – 고정된 과매수/과매도 수준에 의존하지 않고 시장 활동에 따라 상한 및 하한 수준이 조정됩니다.
지표 읽는 방법
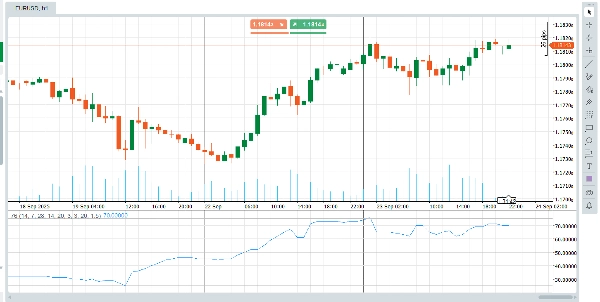
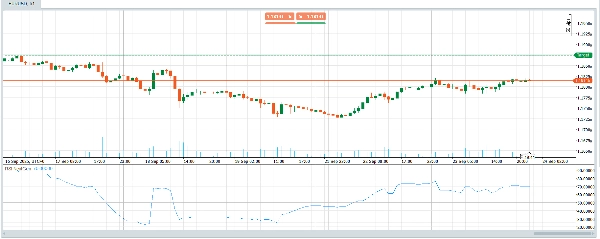
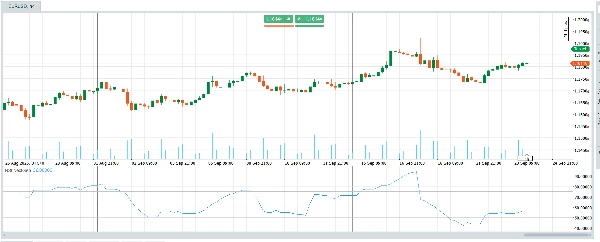
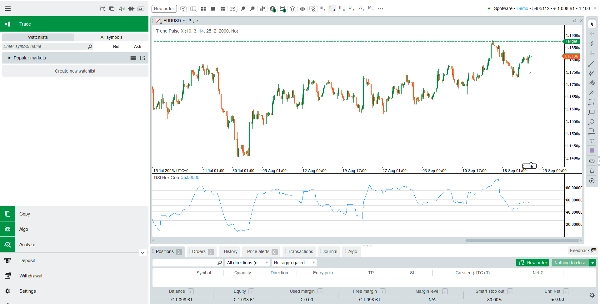
이 지표는 메인 차트 아래 별도의 창에 0에서 100 사이의 단일 선으로 표시됩니다:
25, 50, 75의 기준 수준은 모멘텀 평가에 도움을 줍니다.
70–75 근처 → 시장이 상승 쪽으로 과도하게 확장되었을 수 있습니다.
30–25 근처 → 시장이 하락 쪽으로 과도하게 확장되었을 수 있습니다.
50은 균형점 역할을 합니다:
50 이상 → 매수자가 우세한 경향이 있습니다.
50 이하 → 매도자가 우세한 경향이 있습니다.
주요 특징
변화하는 시장 상황에 자동으로 적응합니다.
변동성, 거래량, 속도를 결합하여 적응형 모멘텀 판독값을 제공합니다.
단일의 읽기 쉬운 선으로 깔끔하고 단순한 인터페이스를 제공합니다.
잠재적인 모멘텀 변화와 과도한 시장 상황을 강조합니다.
여러 시간대와 거래 스타일에 적합합니다.
최종 참고 사항
RSI NextGen은 고전적인 RSI의 차세대 해석으로, 트레이더에게 모멘텀과 잠재적 전환점에 대해 더 적응적인 관점을 제공합니다. 이는 분석 도구로 의도되었으며, 다른 형태의 시장 분석 및 위험 관리와 함께 사용할 때 가장 효과적입니다.
요약
고객 리뷰
5 | 0 % | |
4 | 100 % | |
3 | 0 % | |
2 | 0 % | |
1 | 0 % |


!["High-Low Divergence [Iridio Capital]" 로고](https://cdn.ctrader.com/image/webp/443c4661-7abb-40f1-842f-4b6ec560649b_40914)


