


คำอธิบาย
#### คุณสมบัติ
- **ช่วงเวลาที่ปรับแต่งได้**: ผู้ใช้สามารถเลือกช่วงเวลาที่ต้องการ (เช่น รายวัน) เพื่อวิเคราะห์ระดับการเปิด อย่าตั้งค่า TF ใด ๆ < 1H.
- **ช่วงเวลาย้อนหลัง**: ตัวบ่งชี้รองรับช่วงเวลาย้อนหลัง ช่วยให้เทรดเดอร์มุ่งเน้นไปที่การเคลื่อนไหวของราคาล่าสุดและระบุจุดที่น่าสนใจได้
- **เส้นแนวโน้มแบบไดนามิก**: มันวาดเส้นแนวโน้มเพื่อแสดงราคาการเปิดของช่วงเวลาที่เลือก ให้สัญญาณภาพที่ชัดเจนสำหรับระดับแนวรับและแนวต้านที่เป็นไปได้
- **ตัวเลือกการติดป้าย**: เทรดเดอร์สามารถเปิดใช้งานป้ายเพื่อแสดงราคาการเปิดโดยตรงบนแผนภูมิ เพิ่มความชัดเจนและความเข้าใจ
- **การปรับแต่งภาพ**: ผู้ใช้สามารถปรับแต่งสีเส้น รูปแบบ และความหนาให้เหมาะกับความชอบและเพิ่มความอ่านง่ายของแผนภูมิ
- **ข้อจำกัดช่วงเวลา**: ตัวบ่งชี้มีการตรวจสอบเพื่อให้ทำงานได้เฉพาะภายในช่วงเวลาขั้นต่ำและสูงสุดที่กำหนดไว้ ป้องกันสัญญาณที่ทำให้เข้าใจผิด
#### บทแนะนำ
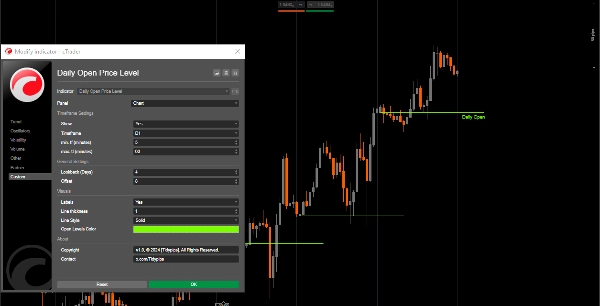
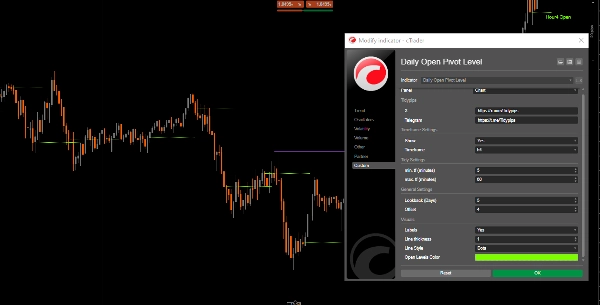
1. **การตั้งค่า**: เปิดการตั้งค่าตัวบ่งชี้เพื่อเลือกช่วงเวลาที่ต้องการ ช่วงเวลาย้อนหลัง และปรับแต่งพารามิเตอร์ภาพ เช่น สีเส้นและความหนา
2. **การใช้ตัวบ่งชี้**: เมื่อนำไปใช้ ตัวบ่งชี้จะวาดระดับราคาการเปิดบนแผนภูมิของคุณโดยอัตโนมัติตามการตั้งค่าที่ระบุ
3. **วิเคราะห์**: สังเกตระดับที่วาดขณะทำการเทรด ใช้ระดับเหล่านี้เพื่อระบุโซนแนวรับและแนวต้านที่เป็นไปได้ และตัดสินใจเทรดอย่างมีข้อมูล
#### เครื่องมือแนะนำสำหรับใช้งานร่วมกัน
- **cTrader**: แพลตฟอร์มหลักสำหรับ cAlgo ที่มอบประสบการณ์ที่ราบรื่นในการใช้และปรับแต่งตัวบ่งชี้
- **เครื่องมือวิเคราะห์ทางเทคนิค**: รวมตัวบ่งชี้นี้กับเครื่องมืออื่น ๆ เช่น ค่าเฉลี่ยเคลื่อนที่หรือออสซิลเลเตอร์ เพื่อเสริมกลยุทธ์การเทรดและการวิเคราะห์ตลาดของคุณ
- **เครื่องมือบริหารความเสี่ยง**: ใช้เครื่องคิดเลขขนาดตำแหน่งและเครื่องมือหยุดขาดทุนเพื่อจัดการความเสี่ยงอย่างมีประสิทธิภาพขณะเทรดรอบระดับการเปิดที่ระบุ
โดยการผสานตัวบ่งชี้ Daily Open Pivot Level กับเครื่องมือเหล่านี้ เทรดเดอร์สามารถเพิ่มประสิทธิภาพการวิเคราะห์ตลาดและเพิ่มโอกาสในการประสบความสำเร็จในการนำทางความซับซ้อนของการเทรดภายในวัน
สรุป
รีวิวจากลูกค้า
5 | 100 % | |
4 | 0 % | |
3 | 0 % | |
2 | 0 % | |
1 | 0 % |


