คำอธิบาย
MoneyMasters - ตัวบ่งชี้แท่ง HTF
ยกระดับประสบการณ์การเทรดของคุณด้วย MM-HTF Bars Indicator เครื่องมือทรงพลังที่ออกแบบมาสำหรับ cTrader ซึ่งซ้อนข้อมูลแท่งเทียนของกรอบเวลาที่สูงกว่า (HTF) ลงบนกราฟปัจจุบันของคุณอย่างราบรื่น ตัวบ่งชี้นี้ให้การแสดงภาพที่ชัดเจนของการเคลื่อนไหวราคาของ HTF ช่วยให้คุณตัดสินใจเทรดได้อย่างมีข้อมูลมากขึ้นโดยการรวมหลายกรอบเวลาไว้ในมุมมองเดียว
คุณสมบัติหลัก:
- กำหนดกรอบเวลาได้: เลือกกรอบเวลาที่สูงกว่า (เช่น 15 นาที, 1 ชั่วโมง) เพื่อแสดงโดยตรงบนกราฟของคุณ
- ควบคุมการซูมแบบไดนามิก: ซ่อนหรือแสดงแท่ง HTF และกรอบเวลาที่ต่ำกว่า (LTF) โดยอัตโนมัติตามระดับการซูมของกราฟเพื่อประสบการณ์ที่ไม่รก
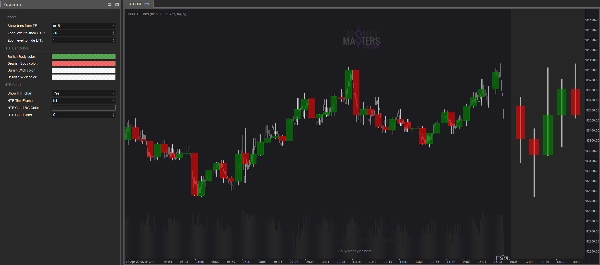
- แท่งเทียนที่มีสีรหัส: แยกแยะแท่งเทียนขาขึ้นและขาลงของ HTF ได้ง่ายด้วยสีตัวแท่งและไส้ที่ปรับแต่งได้
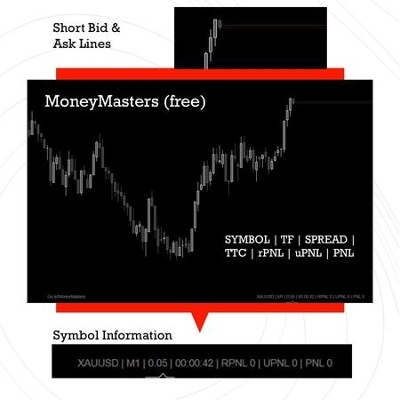
- การแสดงผลที่แม่นยำ: แสดงระดับเปิด สูง ต่ำ และปิดของ HTF โดยจัดตำแหน่งอย่างถูกต้องกับเส้นเวลาของกราฟคุณ
- การผสานรวมอย่างราบรื่น: ทำงานเป็นเลเยอร์ซ้อนทับ ทำให้กราฟของคุณสะอาดและอ่านง่าย
ประโยชน์:
- เข้าใจแนวโน้มตลาดได้ลึกซึ้งขึ้นโดยการวิเคราะห์การเคลื่อนไหวราคาของ HTF ควบคู่กับข้อมูล LTF
- ปรับปรุงกลยุทธ์การเทรดของคุณโดยการระบุระดับแนวรับและแนวต้านสำคัญของ HTF
- ประหยัดเวลาและความพยายามโดยไม่ต้องสลับไปมาระหว่างกราฟหลายอัน
ไม่ว่าคุณจะเป็นสแค็ปเปอร์ เทรดเดอร์รายวัน หรือเทรดเดอร์สวิง MM-HTF Bars Indicator เป็นเครื่องมือที่จำเป็นเพื่อเพิ่มประสิทธิภาพการวิเคราะห์ตลาดและกระบวนการตัดสินใจของคุณ
เริ่มเทรดอย่างชาญฉลาดวันนี้!
----------
อัปเดต 1.02 / 25041201:
- HTF MINI CHART - ตอนนี้แสดงมินิชาร์ตทางด้านขวาพร้อมแท่งเทียน HTF คุณสามารถเลือกกรอบเวลาและจำนวนแท่งเทียนที่จะแสดงได้
----------
อัปเดต 1.01 / 25040901:
- การทำงานที่ราบรื่นขึ้น - ตอนนี้ตัวบ่งชี้จะอัปเดตเมื่อมีการเปลี่ยนแปลงการซูม ไม่ใช่ทุก tick
- ตัวบ่งชี้สามารถเปลี่ยนแท่งเทียนได้เมื่อหยุดชั่วคราวใน Market Reply
สรุป
รีวิวจากลูกค้า
5 | 100 % | |
4 | 0 % | |
3 | 0 % | |
2 | 0 % | |
1 | 0 % |