MM-Symbol Info (free)
อินดิเคเตอร์
328 ดาวน์โหลด
เวอร์ชัน 1.0, Oct 2024
Windows, Mac
5.0
รีวิว: 2
คำอธิบาย
ขอแนะนำ ตัวบ่งชี้ cTrader ฟรีของเรา "MM-Symbol Info (free)" – เพื่อนร่วมทางที่ดีที่สุดของคุณสำหรับประสบการณ์การเทรดที่ราบรื่นและมีประสิทธิภาพ!
คุณสมบัติหลัก
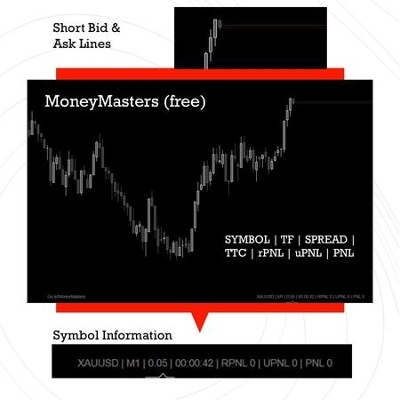
ตัวบ่งชี้นี้จะแสดงข้อมูลที่จำเป็นที่สุดสำหรับผู้เทรดรายวันบนหน้าจอ
- คู่สกุลเงิน: รู้เสมอว่าคุณกำลังเทรดคู่สกุลเงินใด
- กรอบเวลา: ติดตามข้อมูลกรอบเวลาที่คุณเลือก
- สเปรด: ติดตามสเปรดแบบเรียลไทม์
- เวลาที่จะปิด: นับถอยหลังเวลาที่เหลือจนถึงแท่งเทียนปัจจุบันปิด
- กำไร/ขาดทุนที่เกิดขึ้นจริง: ตรวจสอบกำไรและขาดทุนที่เกิดขึ้นจริงของคุณสำหรับวันนั้น -> กำไร/ขาดทุนของตำแหน่งที่ปิดสำหรับสัญลักษณ์นั้น
- กำไร/ขาดทุนที่ยังไม่เกิดขึ้นจริง: อัปเดตกำไรและขาดทุนที่ยังไม่เกิดขึ้นจริงของคุณสำหรับวันนั้น -> กำไร/ขาดทุนของตำแหน่งที่เปิดสำหรับสัญลักษณ์นั้น
- กำไร/ขาดทุนรวม: รับภาพรวมที่ครบถ้วนของกำไรและขาดทุนของคุณสำหรับวันนั้น -> RPNL + UPNL
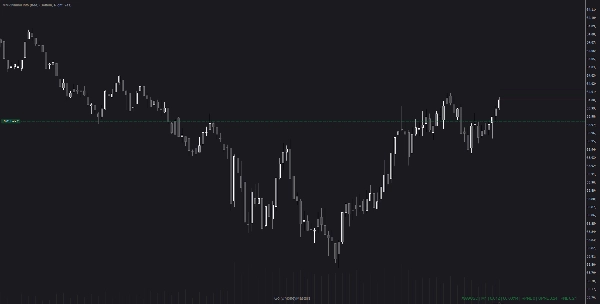
- เส้นราคาขายและซื้อสั้น: แสดงราคาซื้อและขายปัจจุบันโดยตรงบนแผนภูมิของคุณ
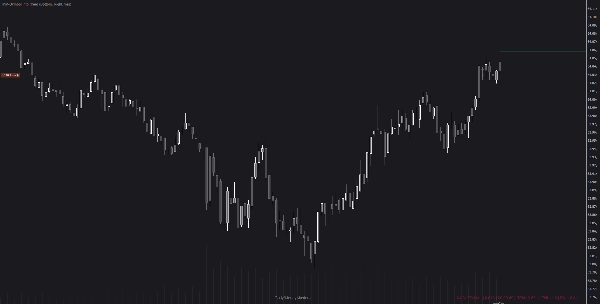
- สีตามกำไร/ขาดทุน: เปลี่ยนสีข้อความเป็นสีเขียวเมื่อวันนั้นมีกำไรและเป็นสีแดงเมื่อวันนั้นขาดทุน
การตั้งค่า
- เปิด/ปิด เส้นราคาซื้อและขาย: สลับเส้นราคาซื้อและขายบนแผนภูมิของคุณได้อย่างง่ายดาย
- การจัดแนวแนวตั้งและแนวนอน: ปรับแต่งการจัดแนวแนวตั้งและแนวนอนของข้อความข้อมูลให้เหมาะกับความชอบของคุณ
การสร้างแบรนด์
- การสร้างแบรนด์แบบง่าย: แสดง URL สั้นของหน้านี้เพื่อการเข้าถึงที่ง่าย
ประโยชน์
- การตัดสินใจที่ดีขึ้น: ด้วยข้อมูลสำคัญทั้งหมดที่ปลายนิ้วของคุณ ทำให้การตัดสินใจเทรดมีข้อมูลมากขึ้น
- ประหยัดเวลา: เข้าใจข้อมูลการเทรดที่สำคัญได้อย่างรวดเร็วโดยไม่ต้องสลับไปมาระหว่างหน้าต่างต่างๆ
- ข้อมูลเชิงลึกระดับมืออาชีพ: รับข้อมูลเชิงลึกเกี่ยวกับประสิทธิภาพการเทรดของคุณด้วยการติดตามกำไร/ขาดทุนและสเปรดแบบเรียลไทม์
- ใช้งานง่าย: การตั้งค่าที่ใช้งานง่ายทำให้เทรดเดอร์ทุกระดับสามารถใช้ตัวบ่งชี้นี้ได้อย่างมีประสิทธิภาพ
ยกระดับการเทรดของคุณด้วยตัวบ่งชี้ cTrader ฟรีของเรา
เริ่มเทรดอย่างชาญฉลาดวันนี้!
- MoneyMasters
สรุป
สรุปโดย AI
MM-Symbol Info (free) is a cTrader indicator designed to provide day traders with essential real-time trading information directly on the chart. It displays the current currency pair, selected time frame, and live spread. The indicator includes a countdown timer showing the remaining time until the current candle closes. It tracks both realized and unrealized profit and loss (PNL) for the day, offering a combined view of total PNL. Visual bid and ask price lines can be toggled on or off for convenience. The PNL text color dynamically changes to green when in profit and red when in loss, enhancing quick interpretation. Users can customize the vertical and horizontal alignment of the displayed information to suit their preferences. The indicator also features simple branding by showing a short URL for easy access. Overall, MM-Symbol Info (free) aims to improve decision-making and time efficiency by consolidating key trading metrics into a user-friendly interface suitable for traders of all levels.
โปรไฟล์อินดิเคเตอร์
รีวิวจากลูกค้า
5.0
รีวิว: 2
5 | 100 % | |
4 | 0 % | |
3 | 0 % | |
2 | 0 % | |
1 | 0 % |
รีวิวจากลูกค้า
August 12, 2025
Pros: Real-time symbol info, customizable panel, low system load. Cons: No parameter selection, no alerts, limited customization.
May 16, 2025
การสนทนา
คำถามที่พบบ่อย
Forex
ผลิตภัณฑ์ที่มีให้บริการผ่าน cTrader Store รวมถึงบอทการเทรด อินดิเคเตอร์ และปลั๊กอิน มีให้บริการโดยนักพัฒนาบุคคลที่สามและมีไว้เพื่อวัตถุประสงค์ในการเข้าถึงข้อมูลและทางเทคนิคเท่านั้น cTrader Store ไม่ใช่โบรกเกอร์และไม่ได้ให้คำแนะนำการลงทุน คำแนะนำส่วนบุคคล หรือการรับประกันผลการดำเนินงานในอนาคต
เพิ่มเติมจากผู้เขียนคนนี้


ราคา
ตั้งแต่ 17/10/2024
54.3M
ปริมาณการเทรด
380.03K
Pips ที่ได้กำไร
2
การขาย
335
ติดตั้งฟรี