説明
📈 Trend Master Pro MultiMA – 究極のトレンド検出ツール 🚀
このインジケーターは 20本の移動平均線 を異なる期間でプロットします (5, 10, 15, 20, 25, 30, 35, 40, 45, 50, 55, 60, 65, 70, 75, 80, 85, 90, 95, および 100)。それぞれについて:
1️⃣ 📊 計算タイプを選択: お好みに応じて SMA、EMA、RMA、WMA、またはVWMA を選択します。オプションで、ノイズを減らしより明確なトレンドを得るために 線形回帰平滑化 を有効にできます。
2️⃣ 📏 参照チャネルを定義: 直近の 200本のローソク足 を使って価格範囲に基づくチャネルを計算します。チャネルの幅は 調整可能 で、価格の変動が大きいと広がり、落ち着いた市場では縮小します。
3️⃣ 📈 移動平均線とチャネルの比較: 各移動平均線はチャネルの高さと、定義された期間(デフォルト: 20本のローソク足)における自身の 高値と安値 と比較して分析されます。
- 📊 移動平均線の最高値と最低値の差がチャネル幅を超える場合、それは 強いトレンド(強気または弱気)を示します。
- ⚖️ 差がチャネル内またはチャネルに近い場合、市場は 中立またはレンジ相場と見なされます。
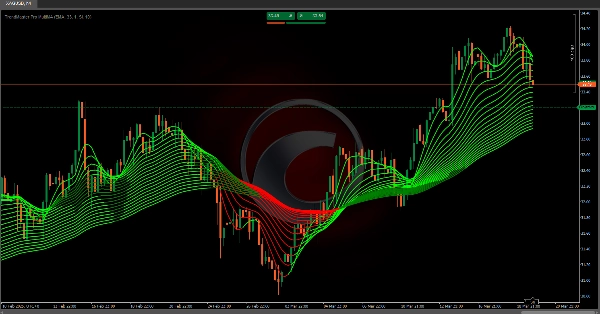
4️⃣ 🎨 トレンドベースのカラーリングシステム: 移動平均線の各セグメントはトレンドの強さと方向に応じて色分けされます:
- 🟢 緑色 = 強気トレンド検出
- 🔴 赤色 = 弱気トレンド検出
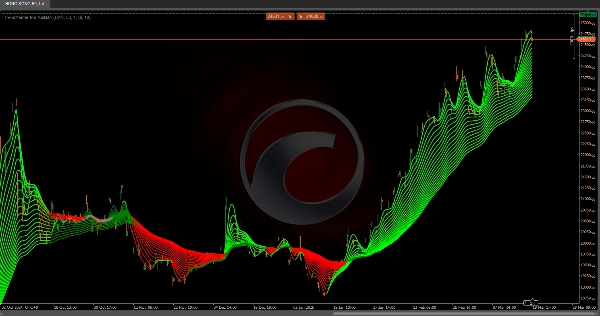
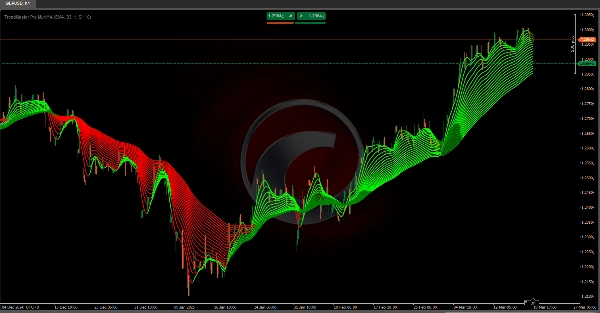
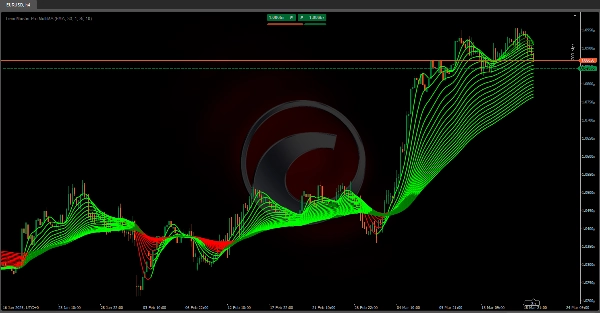
5️⃣ 📉 トレンドの視覚化: インジケーターは ローソク足ごとに各移動平均線の値をつなぎ、トレンドラインの 扇状構造 を形成します。各移動平均線は計算されたトレンドに基づいて動的に色を調整します。
✅ なぜTrend Master Pro MultiMAを使うのか?
この マルチタイムフレーム適応アプローチ—複数の移動平均線、価格チャネル、回帰平滑化を組み合わせて— 市場のフェーズを迅速に特定します:
🔹 強気トレンド ✅
🔹 弱気トレンド ❌
🔹 レンジ/横ばいの動き 🔄
🚀 短期、中期、長期のタイムフレームでより良い意思決定を行いたいトレーダーに最適な 明確な視覚的洞察! 📊🔥
Ctrader Storeのインジケーター:
Dynamic Market Structure
Analysis of Turning Points
Fibonacci Linear
Regression Multi-timeframe
Multi-Level Candle Bias
Tracker
Auto Support and
Resistance Trend Lines
概要
Each moving average is compared against this channel and its own highs and lows over a defined period (default 20 candles). If the range of a moving average exceeds the channel width, it signals a strong bullish or bearish trend; if within or near the channel, the market is considered neutral or ranging. The indicator visually represents trends by connecting moving average values candle-to-candle, forming a fan-like structure of trendlines. Trend strength and direction are indicated by color coding: green for bullish and red for bearish trends.
This multi-timeframe adaptive tool integrates multiple moving averages, price channels, and regression smoothing to help traders quickly identify market phases—bullish, bearish, or ranging—across short, medium, and long-term timeframes.
カスタマーレビュー
5 | 100 % | |
4 | 0 % | |
3 | 0 % | |
2 | 0 % | |
1 | 0 % |