説明
TrendFallowing: は、複数の分析手法を単一のソリューションに統合したcTraderプラットフォーム向けの高度なテクニカル指標です。インジケーターの収束によるトレンド確認を求めるトレーダー向けに開発されており、正確なシグナルと検証フィルターを備えた完全な市場ビューを提供します。
操作戦略の紹介ビデオをご覧ください!
🎯 使用戦略
1. トレンドフォロー取引
適用: 確立されたトレンドを識別し追従する
時間軸: 長期ポジションにはH4、D1
設定: ADX > 25、平均以上の出来高
リスク管理: 50期間移動平均線の下にストップロス
2. スイングトレード
適用: 中期の動きを捉える
時間軸: H1、H4
設定: 出来高フィルター有効、Volume Profileによる確認
目標: Volume Profile POCをTPとして設定
3. ブレイクアウト取引
適用: サポート/レジスタンスのブレイクアウトでエントリー
設定: 動きの強さを確認するためのPVA出来高
確認: ADX上昇 + 平均以上の出来高
4. スキャルピング(短時間足)
適用: 複数の確認を伴う迅速な取引
時間軸: M1、M5
設定: 厳格な出来高フィルターとモメンタム
🔧 インジケーターの動作方法
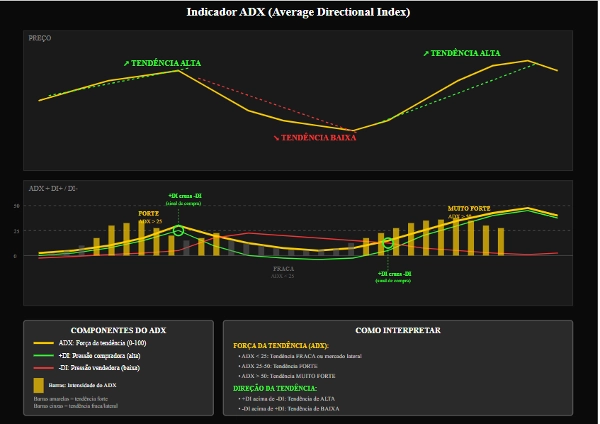
コアADX & DI
ADX(平均方向性指数)
機能: トレンドの強さを測定
解釈:
0-25: 弱いトレンド/横ばいの動き
25-50: 強いトレンド
50以上: 非常に強いトレンド
実用例: ADXが20未満の場合は取引を避ける
+DI / -DI(方向性指標)
+DI: 買いの強さ
-DI: 売りの強さ
シグナル: +DIが-DIを上回るクロスオーバー(買い)およびその逆
ADXスロープ(ADX Slope)
機能: トレンドの加速を測定
プロット: シアンのヒストグラム
シグナル: 正の値はトレンドの強化を示す
出来高フィルター
出来高MAフィルター
機能: 平均以上の出来高でシグナルを検証
パラメーター: 期間20、乗数1.0
使用法: 機関投資家の関心の確認
PVA出来高(価格出来高分析)
色と意味:
緑: 非常に高い出来高での買い(平均の150%以上)
青: 高い出来高での買い
赤: 非常に高い出来高での売り
ピンク: 高い出来高での売り
黄色: ピンバー/サポートブレイクによる疲弊
出来高プロファイル
POC(コントロールポイント)
機能: 最も取引量の多い価格
使用法: 取引の自然な目標、動的なサポート/レジスタンス
バリューエリア
機能: 出来高の70%が取引されたゾーン
解釈:
価格が上: 上昇トレンド
価格が下: 下降トレンド
内部: 横ばいの可能性
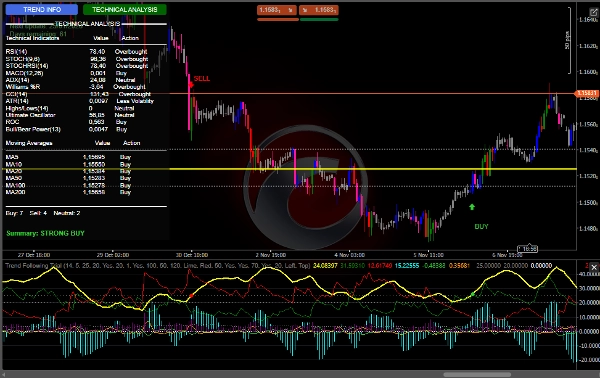
インジケーターパネル
RSI: 売られ過ぎ(<30)/ 買われ過ぎ(>70)
MACD: モメンタム
Williams %R: 極端な状態
CCI: 反転の識別
ストキャスティクス: 短期モメンタム
アルティメットオシレーター: マルチタイムフレームモメンタム
移動平均線
完全なMAセット(5、10、20、50、100、200)
トレンドの整列分析
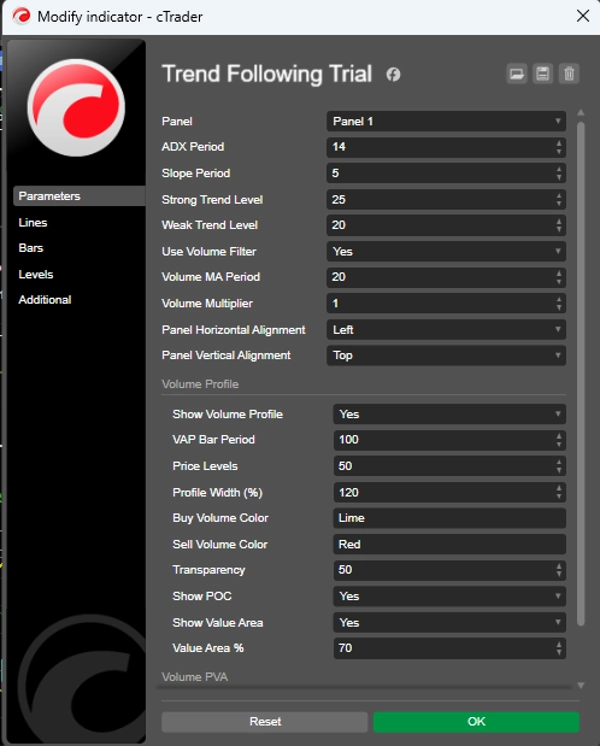
⚙️ 推奨設定
保守的設定
ADX期間: 14
スロープ期間: 5
強いトレンドレベル: 25
弱いトレンドレベル: 20
出来高フィルター使用: true
出来高MA期間: 20
出来高乗数: 1.2
積極的設定
ADX期間: 10
スロープ期間: 3
強いトレンドレベル: 20
弱いトレンドレベル: 15
出来高フィルター使用: true
MA出来高期間: 14
出来高乗数: 1.0
出来高プロファイル(推奨)
出来高プロファイル表示: true
VAPバー期間: 100
価格レベル: 50
バリューエリア%: 70
POC表示: true
🎨 ビジュアルリソース
ユーザーインターフェース
ダイナミックパネル: リアルタイム情報
インタラクティブボタン: 分析の切り替え
直感的な色分け: 機能別コーディング
グラフィカルシグナル
矢印: 買い/売りエントリー
サウンド: 聴覚アラート
バーの色: 統合されたPVA分析