
Opis
Zmęczony spędzaniem wieczności na oznaczaniu swoich wykresów? Ten wskaźnik robi to za Ciebie bardzo szybko.
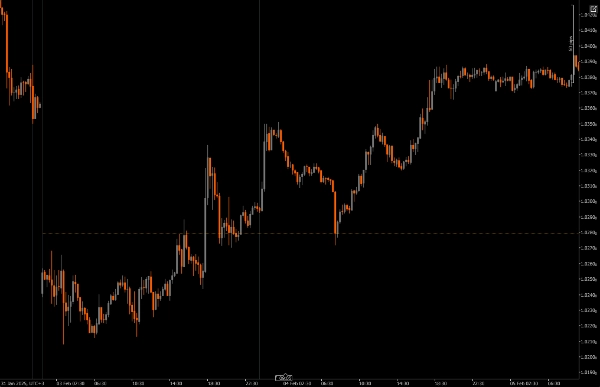
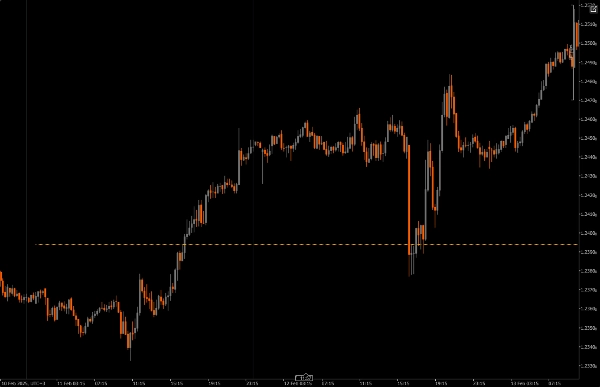
Znajduje punkt środkowy pomiędzy najwyższym a najniższym poziomem z poprzedniego dnia i nanosi go na Twoje wykresy. Teraz możesz bardzo szybko przeglądać swoje wykresy. Proste jak drut!
Kilka fajnych funkcji
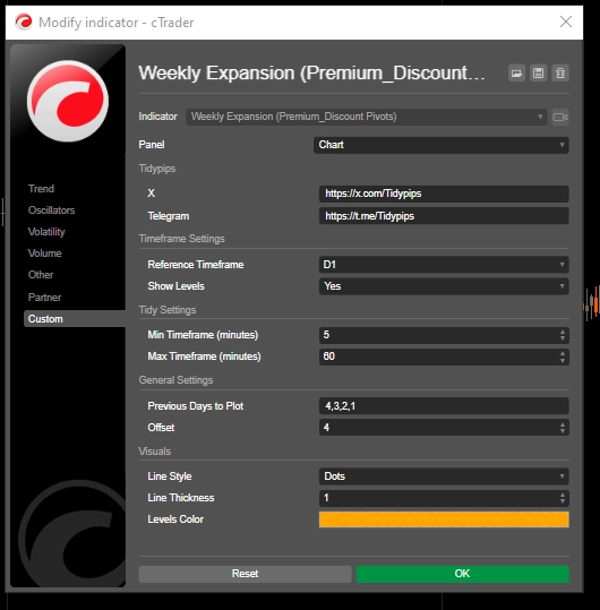
Dostosowywany okres odniesienia: Możesz wybrać minimalny i maksymalny okres, aby nanieść znaczące poziomy cenowe, co pomaga dopasować Twoje intradayowe transakcje do szerszych trendów rynkowych.
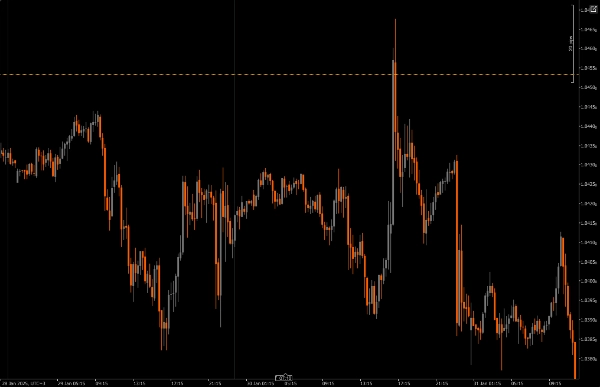
To, co wyróżnia ten wskaźnik, to zdolność do śledzenia świecy tygodniowej na bieżąco, dzień po dniu, co ułatwia uchwycenie ekspansji świecy tygodniowej.
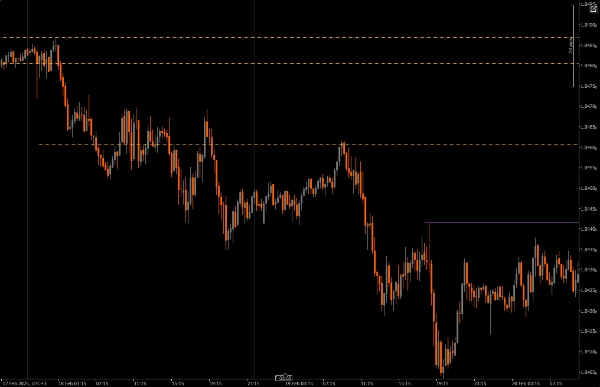
Parametr przesunięcia: Ta funkcja pozwala zdecydować, jak daleko w przyszłość rozciągają się naniesione poziomy, dając jaśniejszy obraz potencjalnych stref kontynuacji ceny.
Personalizacja wizualna: Masz wiele opcji do dostosowania stylów linii, grubości i kolorów, co ułatwia stworzenie wykresu dopasowanego do Twojego stylu i łatwego do odczytania.
Ograniczenia okresu: Wskaźnik zawiera kontrole, które zapewniają, że działa tylko w ramach określonych przez Ciebie ustawień okresu, dzięki czemu unikniesz zaśmiecenia wykresu podczas przełączania się między innymi okresami.
Warto zauważyć:
Osobisty faworyt
Jeśli, tak jak ja, nie możesz się powstrzymać przed dodawaniem „szminki” na swoje wykresy, wypróbuj ten wskaźnik. Ma ograniczenia okresu i funkcję okresu retrospektywnego, które mają na celu zmniejszenie zaśmiecenia wykresu.
Ten wskaźnik jest przydatny do śledzenia, jak rozwija się świeca tygodniowa; jeśli tygodniowa ekspansja wykazuje oznaki byczego przepływu zleceń, poziomy pivot na tym wskaźniku wizualizują obszary lub strefy dołączenia do byczej ekspansji, podobnie jeśli tygodniowa ekspansja wykazuje niedźwiedzi przepływ zleceń, poziomy pivot na tym wskaźniku wizualizują obszary lub strefy dołączenia do niedźwiedziej ekspansji.
Instalacja: Zacznij od pobrania i zainstalowania Previous Day Equilibrium na swojej platformie cAlgo.
Konfiguracja: Otwórz ustawienia, aby wybrać okres odniesienia, określ, ile poprzednich dni chcesz nanieść, i dostosuj ustawienia wizualne według własnych upodobań.
Analiza: Podczas handlu zwracaj uwagę na naniesione poziomy na wykresie. Te poziomy wskazują miejsca, gdzie cena może się odwrócić, bazując na historycznych ruchach cen, pomagając podejmować bardziej świadome decyzje.
Realizacja: Używaj tych poziomów do określania punktów wejścia i wyjścia, a także zleceń stop-loss i take-profit, integrując je z ogólną strategią handlową.
Polecane narzędzia towarzyszące:
cTrader: To najlepsza platforma do korzystania z Previous Day Equilibrium, zapewniająca płynne doświadczenie w dostosowywaniu i analizie.
Narzędzia analizy technicznej: Połącz ten wskaźnik z innymi narzędziami, takimi jak średnie kroczące czy oscylatory, aby uzyskać pełniejszy obraz trendów rynkowych.
Narzędzia zarządzania ryzykiem: Wykorzystaj kalkulatory i narzędzia stop-loss, aby skutecznie zarządzać ryzykiem podczas handlu wokół tych kluczowych poziomów.
Korzystając z Previous Day Equilibrium wraz z tymi narzędziami, możesz ulepszyć swoją strategię handlową i zwiększyć szanse na sukces w szybkim świecie handlu intraday.
Podsumowanie
Opinie klientów
5 | 0 % | |
4 | 100 % | |
3 | 0 % | |
2 | 0 % | |
1 | 0 % |


