
설명
이 지표는 종가, 시가, 고가, 저가의 네 가지 독립 변수를 사용하여 다중 비선형 회귀 분석을 수행하도록 설계되었습니다.
구성 요소 및 기능은 다음과 같습니다:
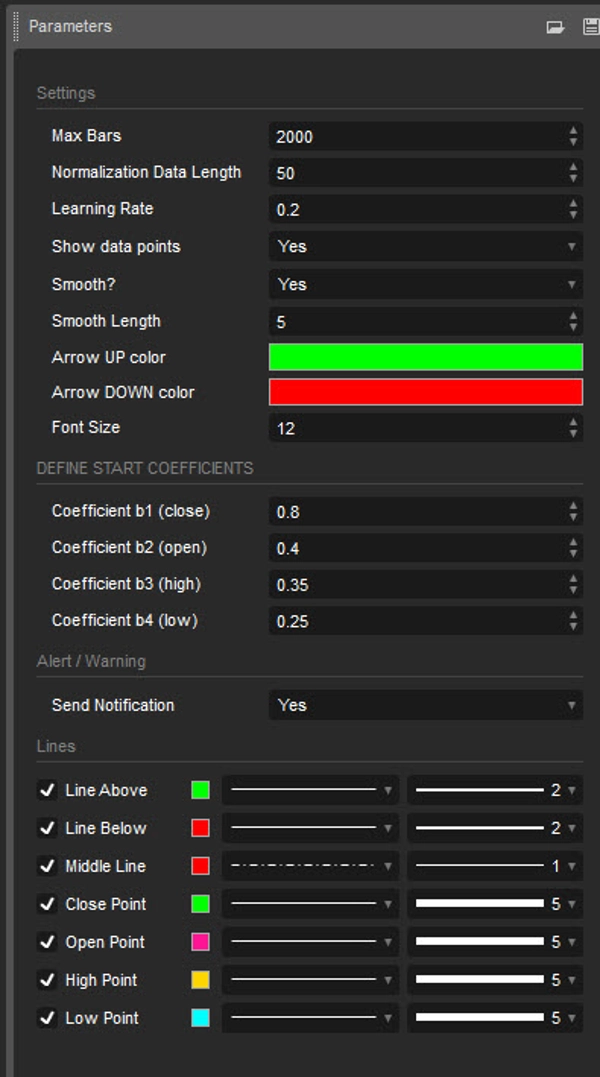
입력값:
- 정규화 데이터 길이: 정규화에 사용되는 데이터 길이.
- 학습률: 알고리즘이 오류로부터 학습하는 속도.
- 데이터 포인트 표시: 정규화된 입력 데이터(종가, 시가, 고가, 저가)의 플로팅 표시.
- 스무스?: 출력값을 부드럽게 할지 선택하는 옵션.
- 스무스 길이: 스무스가 활성화된 경우의 길이.
- 시작 계수 정의: 회귀 방정식의 초기 계수.
데이터 정규화:
스크립트는 지정된 길이 내에서 가장 높고 낮은 값을 사용하여 입력 데이터를 0과 1 사이의 범위로 정규화합니다.
비선형 회귀:
입력된 계수와 정규화된 데이터를 사용하여 회귀 방정식을 계산합니다. 사용된 방정식은 독립 변수들의 가중 합이며, 계수는 오류를 최소화하기 위해 경사 하강법을 사용하여 반복적으로 조정됩니다.
오류 계산:
스크립트는 실제 값과 예측 값 간의 오류를 계산합니다.
경사 하강법:
계수는 오류를 최소화하기 위해 경사 하강법을 사용하여 반복적으로 업데이트됩니다.
시각화:
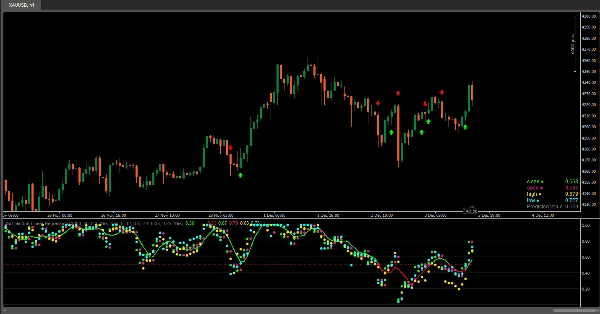
- 정규화된 입력 데이터(종가, 시가, 고가, 저가)의 플로팅.
- 이 지표는 차트에 원형 마커 형태로 정규화된 데이터 값(종가, 시가, 고가, 저가)을 시각화하여 사용자가 이 값들의 상대적 위치와 회귀선과의 관계를 쉽게 관찰할 수 있도록 합니다.
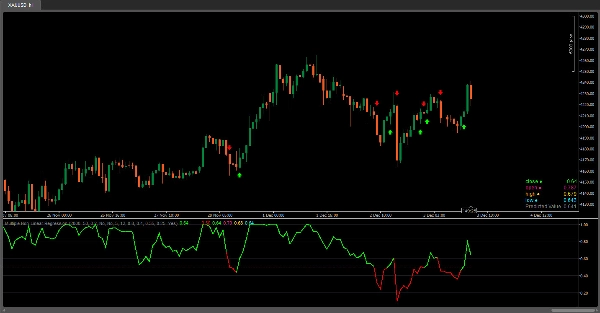
- 회귀선 플로팅.
- 값과 봉 색상에 따른 회귀선의 색상 그라데이션.
- 정규화된 입력 데이터와 예측 값을 표로 표시.
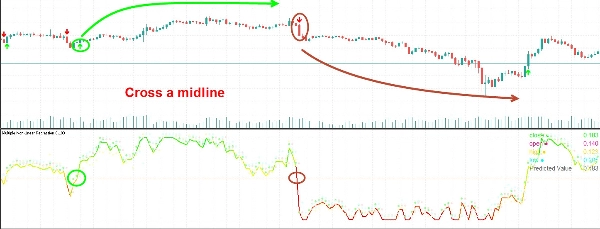
- 중간선(0.5)과의 교차 신호 표시.
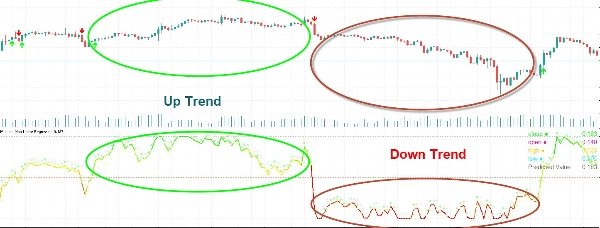
해석:
사용자는 회귀선과 중간선(0.5)과의 교차를 매수 또는 매도 기회의 신호로 해석할 수 있습니다.
이 지표는 사용자가 여러 변수 간의 관계를 분석하고 회귀 분석을 기반으로 거래 결정을 내리는 데 도움을 줍니다. 계수와 매개변수를 조정하여 특정 시장 상황에 맞게 모델의 성능을 미세 조정할 수 있습니다.
요약
지표 프로필
고객 리뷰
5.0
리뷰: 1
5 | 100 % | |
4 | 0 % | |
3 | 0 % | |
2 | 0 % | |
1 | 0 % |
상담
자주 묻는 질문(FAQ)
BTCUSD
Forex
Signal
Crypto
XAUUSD
NAS100
트레이딩 봇, 지표, 플러그인 등 cTrader Store에서 제공되는 상품은 제3자 개발자에 의해 제공되며, 이는 단순히 정보 및 기술적 접근을 목적으로 제공된 것입니다. cTrader Store는 중개인이 아니며, 투자 조언, 개인별 추천 또는 향후 성과에 대한 어떠한 보장도 제공하지 않습니다.
이 작성자의 상품 더 보기


좋아하실 만한 다른 항목


가격
38
판매
2.39K
무료 설치