
설명
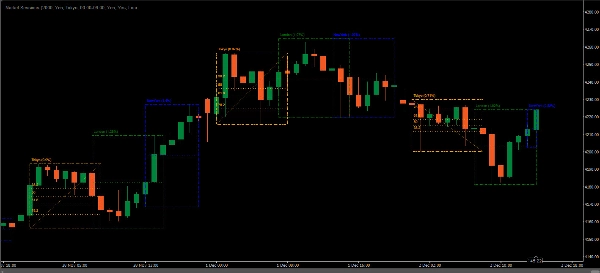
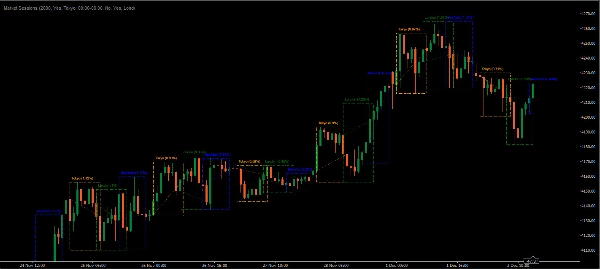
Market Sessions 지표는 가격 차트에서 전 세계 거래 세션을 시각적으로 나타내는 외환 및 주식 거래자들 사이에서 인기 있는 도구입니다. 주요 거래 세션인 아시아(도쿄), 유럽(런던), 그리고 미국(뉴욕) 세션의 시간대를 차트에 직접 표시합니다. 이를 통해 거래자들은 시장이 언제 열리고 닫히는지 파악하여 세션별 거래 행동에 기반한 더 나은 의사결정을 할 수 있습니다.
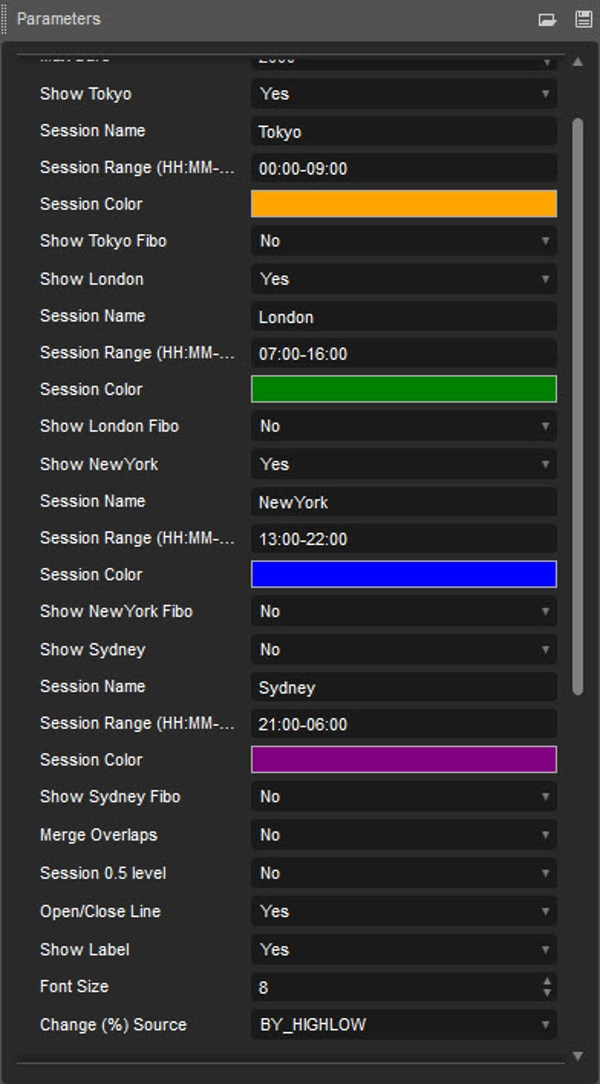
- 아시아 세션 (기본값: 00:00-09:00)
- 런던 세션 (기본값: 07:00-16:00)
- 뉴욕 세션 (기본값: 13:00-22:00)
- 시드니 세션 (기본값: 21:00-06:00)
Market Sessions 지표의 주요 특징
- 세션 시간 및 중첩:
-
- 이 지표는 각 세션의 시작 및 종료 시간을 표시합니다. 각 세션은 고유한 특성을 가지는데, 예를 들어 아시아 세션은 일반적으로 조용한 반면, 런던 세션은 높은 변동성을 보입니다. 런던-뉴욕 중첩과 같은 중첩 시간도 표시되어 활동이 증가하는 시기를 나타냅니다.
- 사용자 지정 가능한 세션 색상:
-
- 거래자들은 각 세션의 색상을 사용자 지정할 수 있어 시각적으로 쉽게 구분할 수 있습니다. 이러한 개인화는 명확성을 더하고 거래자들이 선호하는 특정 세션에 집중할 수 있도록 돕습니다.
- 조정 가능한 시간대:
-
- 거래자들이 전 세계에 분포해 있기 때문에, 이 지표는 일반적으로 시간대를 조정할 수 있어 세션 시작 및 종료 시간을 거래자의 현지 시간에 맞출 수 있습니다. 이는 주요 거래 센터와 다른 시간대에 있는 거래자들에게 특히 유용합니다.
- 세션별 전략:
-
- 각 세션은 독특한 특성을 가지고 있습니다. 예를 들어, 런던 세션 은 종종 가장 변동성이 높아 돌파 기회를 제공하며, 아시아 세션 은 비교적 조용하여 범위 거래 전략에 적합할 수 있습니다. 이러한 차이를 이해하면 거래자들이 세션별 추세에 맞춰 전략을 조정할 수 있습니다.
Market Sessions 지표를 사용하는 이유
- 더 나은 거래 타이밍:
-
- 어떤 세션이 활성화되어 있는지 알면 거래자들은 변동성과 유동성의 다양한 수준을 활용하기 위해 전략을 조정할 수 있습니다.
- 향상된 분석 및 전략 개발:
-
- 세션 시간이 시각적으로 표시되어 있어 거래자들은 세션별 가격 움직임을 분석하고 각 세션의 특성에 맞는 전략을 개발 및 개선할 수 있습니다.
- 시장 변동성에 대한 인식 증가:
-
- 변동성은 세션 시작, 종료 및 중첩 시기에 급증하는 경향이 있습니다. 이 지표는 이러한 움직임을 예측하는 데 도움을 주어 갑작스러운 시장 변동에 놀라는 일을 줄여줍니다.
사용 예시
변동성에 관심 있는 거래자는 런던-뉴욕 중첩 기간을 목표로 하여 더 큰 시장 움직임을 활용할 수 있습니다. Market Sessions 지표를 사용하면 이 중첩 시간에 맞춰 거래를 계획하여 중요한 가격 움직임을 포착할 가능성을 높일 수 있습니다.
요약하자면, Market Sessions 지표는 시간별 시장 행동에 기반한 정보에 입각한 결정을 내리고자 하는 거래자들에게 필수적입니다. 명확성을 제공하고 분석을 향상시키며 더 효과적인 거래 전략을 지원할 수 있습니다.
요약
AI 요약
The Market Sessions indicator visually displays major global trading sessions directly on price charts, aiding forex, stock, and crypto traders in identifying active market periods. It highlights the Asian (Tokyo), European (London), American (New York), and Sydney sessions with default time ranges, marking their start and end times as well as overlaps, such as the London-New York overlap known for increased volatility. Traders can customize session colors for clear visual distinction and adjust time zones to align session times with their local time. By showing session-specific market behavior—calmer Asian sessions versus volatile London sessions—the indicator supports tailored trading strategies and improved timing of trades. It enhances analysis by allowing users to observe price action across different sessions and anticipate volatility spikes during session openings, closings, and overlaps. This tool is applicable across multiple markets including forex, cryptocurrencies (e.g., BTCUSD, ETH), indices (e.g., NAS100), and commodities (e.g., XAUUSD). The indicator facilitates informed decision-making based on session dynamics, helping traders optimize entry and exit points according to time-specific market activity.
지표 프로필
고객 리뷰
4.3
리뷰: 3
5 | 33 % | |
4 | 67 % | |
3 | 0 % | |
2 | 0 % | |
1 | 0 % |
고객 리뷰
April 26, 2026
Can you check the indicator code. Unable to edit timeline. As new york and london times vary.
December 10, 2025
Market Sessions Pre highlights Asian, London and NY sessions with clear visual blocks. Perfect for intraday timing and volatility awareness. Lightweight, stable and clean. Great with SMC/ICT concepts. Would benefit from alerts and killzone markers, but already a highly useful tool.
상담
자주 묻는 질문(FAQ)
BTCUSD
Forex
Signal
Scalping
EURUSD
Crypto
XAUUSD
NAS100
트레이딩 봇, 지표, 플러그인 등 cTrader Store에서 제공되는 상품은 제3자 개발자에 의해 제공되며, 이는 단순히 정보 및 기술적 접근을 목적으로 제공된 것입니다. cTrader Store는 중개인이 아니며, 투자 조언, 개인별 추천 또는 향후 성과에 대한 어떠한 보장도 제공하지 않습니다.
이 작성자의 상품 더 보기


가격
38
판매
2.38K
무료 설치