
설명
공정 가치 격차 (FVG) 지표
개요
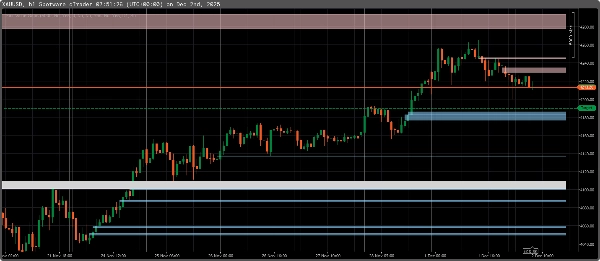
공정 가치 격차 (FVG) 지표 는 공격적인 매수 또는 매도로 인해 불균형이 발생하는 가격 움직임의 비효율성을 식별합니다. 이러한 격차는 종종 기관 투자자와 스마트 머니에 의해 생성되며, 가격이 추세를 계속하기 전에 나중에 "채우기" 위해 돌아올 수 있는 영역을 남깁니다.
주요 특징:
- FVG 자동 감지 – 지표는 다양한 시간대에서 공정 가치 격차를 강조 표시합니다.
- 다중 시간대 지원 – 낮은 시간대 차트에서 높은 시간대의 FVG를 볼 수 있습니다.
작동 원리:
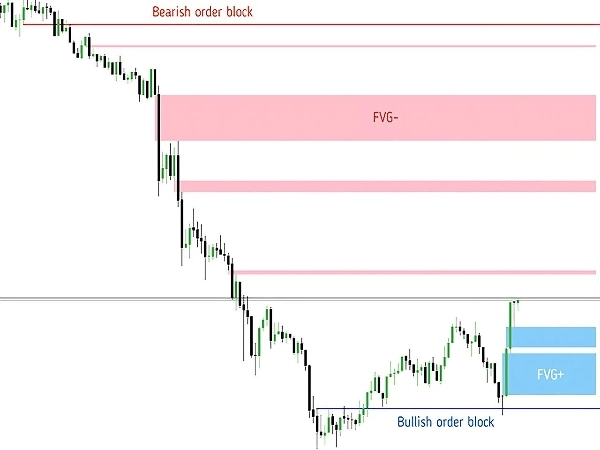
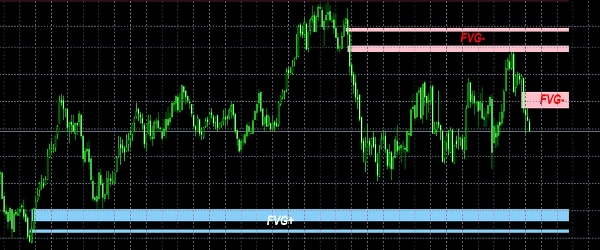
- 지표는 가격 움직임을 스캔하여 캔들의 고가가 두 캔들 앞의 저가와 겹치지 않는 격차(강세 FVG) 또는 그 반대(약세 FVG)를 감지합니다.
- 이 영역들은 가격이 지배적인 추세를 계속하기 전에 다시 방문할 수 있는 잠재적 유동성 구역으로 표시됩니다.
- 지표는 FVG를 BOS, CHoCH 및 주문 블록과 결합하여 거래자가 스마트 머니 흔적을 인식하는 데 도움을 줍니다.
FVG를 사용한 거래 방법:
- 진입 전략: 가격이 FVG 구역에 돌아와 반응할 때까지 기다리세요(거부, 지지 또는 저항).
- 합류 거래: BOS, 주문 블록 및 유동성 스윕과 결합하여 정확도를 높이세요.
- 이익 실현 목표: 다음 유동성 풀 또는 주요 구조 수준을 고려하세요.
이 지표를 사용해야 하는 사람:
- 스마트 머니 및 ICT 트레이더
- 가격 행동 및 기관 투자자
- 스캘퍼 및 스윙 트레이더
요약
AI 요약
The Fair Value Gap (FVG) Indicator detects price action inefficiencies caused by aggressive buying or selling, often linked to institutional traders. It automatically identifies fair value gaps—areas where a candle’s high does not overlap with the low of two candles ahead (bullish FVG) or vice versa (bearish FVG)—across multiple timeframes, allowing users to view higher timeframe gaps on lower timeframe charts. These gaps represent potential liquidity zones where price may revisit before continuing its trend. The indicator helps traders recognize smart money footprints by combining FVG analysis with Break of Structure (BOS), Change of Character (CHoCH), and Order Blocks. Trading strategies using this indicator involve waiting for price reactions at FVG zones for entry, using confluence with other smart money concepts for accuracy, and targeting subsequent liquidity pools or major structure levels for take profit. It is suitable for smart money, ICT, price action, institutional traders, scalpers, and swing traders operating in markets including Forex, Crypto, and indices such as BTCUSD, EURUSD, XAUUSD, and NAS100.
지표 프로필
고객 리뷰
5.0
리뷰: 1
5 | 100 % | |
4 | 0 % | |
3 | 0 % | |
2 | 0 % | |
1 | 0 % |
고객 리뷰
December 10, 2025
A clean and accurate Fair Value Gap detector. Highlights bullish/bearish FVGs with minimal lag and great clarity. Useful for intraday and swing ICT/SMC setups. Can get busy on lower TFs, but filtering helps. Alerts, MTF mode and FVG state tracking would take it to the next level.
상담
자주 묻는 질문(FAQ)
BTCUSD
Forex
Scalping
EURUSD
Fair Value Gap
SMC
Crypto
XAUUSD
NAS100
트레이딩 봇, 지표, 플러그인 등 cTrader Store에서 제공되는 상품은 제3자 개발자에 의해 제공되며, 이는 단순히 정보 및 기술적 접근을 목적으로 제공된 것입니다. cTrader Store는 중개인이 아니며, 투자 조언, 개인별 추천 또는 향후 성과에 대한 어떠한 보장도 제공하지 않습니다.
이 작성자의 상품 더 보기


가격
38
판매
2.38K
무료 설치