설명
Pinescritlabs
Ctrader Store indicators: 🤖Pinescritlabs Ctrader Store cBots:
Fair Value Gap Sessions Gold & BTC Breakout Session Pivots
Dynamic Market Structure
Analysis of Turning Points
Fibonacci Linear
Regression Multi-timeframe
Multi-Level Candle Bias
Tracker
Auto Support and
Resistance Trend Lines
All Support and
Resistance Levels
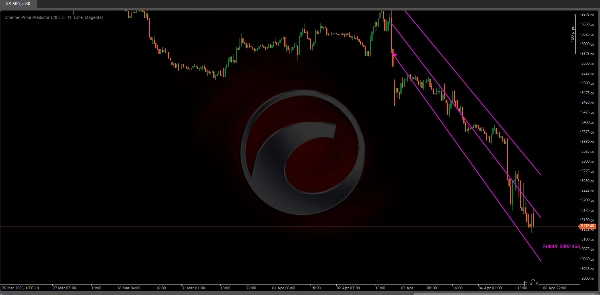
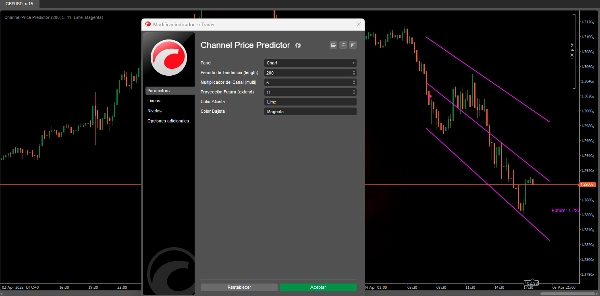
채널 가격 예측기는 차트에 추세 채널(상승 또는 하락)을 식별하고 그려 미래의 가능한 가격 영역을 예측합니다. 📈🔮
이 채널은 시장 변동성을 측정하는 ATR(평균 실제 범위)를 기반으로 합니다. 최근 변동성이 클수록 채널이 넓어져 가능한 움직임 범위를 시각화하는 데 도움이 됩니다. 📊💥
피벗 고점과 저점을 기반으로 채널을 자동으로 식별하고 그립니다.
채널 라인을 확장하고 미래 가격을 예측하는 옵션이 있습니다. 🕒📉
이 채널은 현재 움직임뿐만 아니라 가능한 가격 값을 나타내는 레이블(“미래: …”)을 통해 미래 가격 예측도 제공합니다. 📅💡
용도는 무엇인가요?
추세 식별:
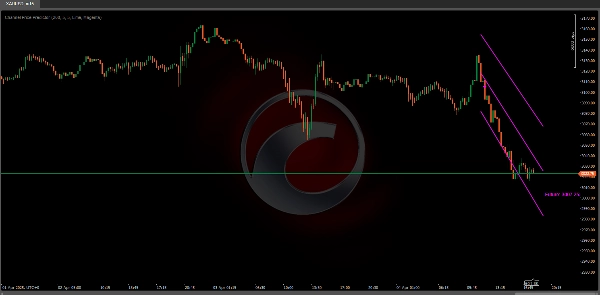
이 지표는 내부 논리를 사용하여 시장이 상승에서 하락(또는 그 반대)으로 전환될 때를 감지합니다. 이를 통해 자산이 상승 또는 하락 국면에 있는지 더 명확하게 시각화할 수 있습니다. 📈🔄📉
변동성 채널:
채널은 변동성을 측정하는 ATR(평균 실제 범위)를 기반으로 합니다. 최근 변동성이 클수록 채널이 넓어집니다. 이는 가능한 움직임 범위를 확인하는 데 도움이 됩니다. 📊🔍
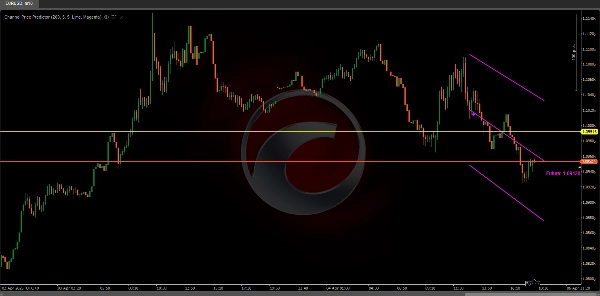
미래 예측:
이 지표는 현재 추세만 보여주는 것이 아니라 채널을 몇 기간(설정 가능) 앞까지 확장하여 해당 추세 내에서 가능한 지지/저항 영역을 예측할 수 있게 합니다. ⏳🚀
채널 라인을 확장하고 미래 가격을 예측할 수 있습니다. ⬆️⬇️
가격 참조:
중앙선과 상하단 가장자리를 그려 변동성에 대한 더 많은 정보를 바탕으로 스톱, 목표 또는 심지어 진입/청산을 관리할 수 있는 참조를 제공합니다. 🎯📍
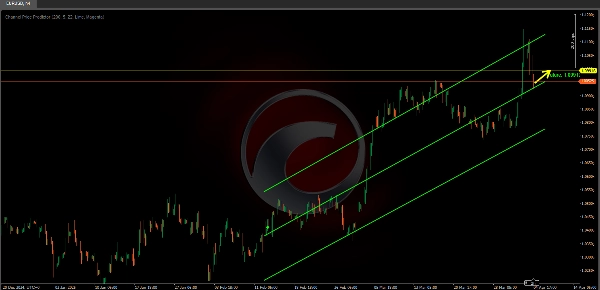
cTrader의 제한으로 인해 현재 차트에서 오른쪽으로 스크롤하여 채널의 미래 확장 부분을 제대로 볼 수 없습니다.
표시 문제를 피하기 위해 “미래 예측” 매개변수를 25 기간 미만으로 설정하는 것이 권장됩니다.
cTrader가 차트를 미래로 확장하는 기능을 구현하면 이 기능을 최대한 활용할 수 있도록 알고리즘을 개선할 예정입니다.
요약
Key features include automatic detection of trend direction changes, visualization of current trend channels, and the ability to extend channel lines into the future. This future projection helps anticipate potential support and resistance zones by displaying estimated price values labeled as “Future: …”. The indicator draws a central line along with upper and lower channel boundaries, providing reference points for placing stops, targets, and managing trade entries and exits with volatility context.
Users can configure the number of periods for future projection, with a recommended maximum of 25 periods to avoid display issues due to cTrader platform limitations. The indicator supports analysis of various markets including cryptocurrencies (e.g., BTCUSD), commodities (e.g., XAUUSD), and others where volatility and trend identification are relevant.
고객 리뷰
5 | 100 % | |
4 | 0 % | |
3 | 0 % | |
2 | 0 % | |
1 | 0 % |