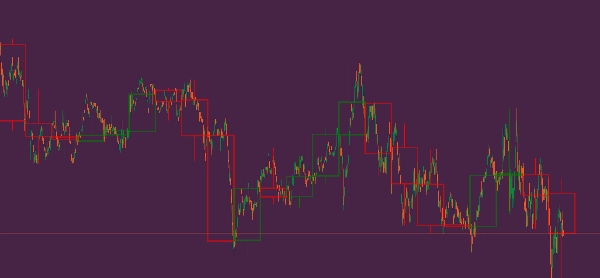
HTFOverlayPlus
"HTFOverlayPlus" 로고
03/09/2025
35
Desktop
Since 10/02/2025
Free installs
479

Este indicador sobrepõe candles de um time frame superior sobre o gráfico do time frame atual. Ele permite visualizar até 50 candles de um time frame maior e ajusta a cor das velas de acordo com a direção do preço (alta ou baixa). O indicador oferece a possibilidade de personalizar a espessura das bordas do corpo das velas e as cores para velas de alta e baixa. Ele é útil para traders que desejam visualizar a ação do preço em time frames superiores enquanto operam em time frames menores, permitindo uma análise mais precisa das tendências. (Obs: funciona com corpo invisível apenas no time frame e o resto apenas pinta.)


This indicator overlays candles from a higher time frame onto the current chart time frame. It allows you to display up to 50 candles from a larger time frame and adjusts the candle color based on price direction (bullish or bearish). The indicator provides the option to customize the body thickness and the colors for bullish and bearish candles. It is useful for traders who want to visualize higher time frame price action while trading on smaller time frames, enabling more accurate trend analysis. (Note: only works with invisible body in the time frame and the rest just paints.)


Este indicador superpone velas de un marco temporal superior en el gráfico del marco temporal actual. Permite mostrar hasta 50 velas de un marco temporal mayor y ajusta el color de las velas según la dirección del precio (alcista o bajista). El indicador ofrece la posibilidad de personalizar el grosor de los bordes del cuerpo de las velas y los colores para las velas alcistas y bajistas. Es útil para los traders que desean visualizar la acción del precio en marcos temporales superiores mientras operan en marcos temporales más pequeños, lo que permite un análisis más preciso de las tendencias. (Nota: solo funciona con cuerpo invisible en el marco temporal y el resto solo pinta.)

이 작성자의 상품 더 보기
지표
VWAP
VWAP Tabajara
VWAP Tabajara
Larry Williams 9.1
Larry Williams 9.1
Tabajara corrigido[fix]
corrigido todos os bugs e cores invertidas tabajara antigo deleetado
좋아하실 만한 다른 항목
Breakout Mode Patterns
Brooks price action breakout mode patterns
TDI_Pro
Traders Dynamic Index (TDI) — Divergence Edition
지표
Indices
Breakout
Supertrend
[CB] Pivot Points Pro
You can use the cTrader Pivot Points Pro indicator to find a good pullback entry in a trend
IRiskRewardTools
Risk Reward Management Tools(风险回报管理工具)
지표
NAS100
Indices
XAUUSD
+4
PrevDayProjection
Automatically calculates the previous day’s high and low, determines the range, and then projects Fibonacci levels.
최고 평점
무료
지표
ATR
Supertrend
PMAX
It's a combination of two trailing stop loss and the other one is well-known ATR-based SuperTrend.
지표
VWAP
Anchored VWAP Buttons
Premium Discount Zones
Premium Discount Zones" spots key areas (🟣Premium/🟢Discount) using recent highs/lows & volume..............
Advanced Market Structure Bos,Choch,SwinLevels, Order Blog
Advanced price action tool that combines multiple technical analysis concepts
KDJ
The KDJ oscillator display consists of 3 lines (K, D and J - hence the name of the display) and 2 levels.
지표
RSI
Breakout
Supertrend
+1
Dynamic Trend Gradient
Identifies trends with moving averages & volatility. Base levels = bullish 🐂 or bearish 🐻 signals. Reversals detected!
지표
Stocks
Forex
Crypto
+1
Market Structure SNR + Auto Bias
Market Structure Indicator – Your Trading Map in a Noisy Market. No more Panicking Which one, Where, Why and How.
지표
Breakout
ATR
Supertrend
+3
Support Resistance Indicator
A custom support resistance indicator, specifically designed for scalping techniques.
R S
This indicator is a simple, single-timeframe tool for showing candle sentiment directly on your chart. If you want a mor
지표
RSI
Stocks
Forex
+1
Market Cipher A
Market Cipher A
KANDIKA HEAT MAP
Color-Based Market Pressure & Volatility Visualizer The Kandika Heatmap Indicator
지표
Breakout
Stocks
Signal
Darvas Box
The Darvas Box involves identifying "boxes" or trading ranges where a stock's price consolidates before breaking out.
지표
NAS100
NZDUSD
Martingale
+22
Indicators Volume Profile 1
Taiz Pro Volume Profile مؤشر احترافي لتحليل الحجم (Volume Profile) يكشف عن مناطق الدعم والمقاومة الحقيقية التي يركز عليه