
VWAP Tabajara
อินดิเคเตอร์
438 ดาวน์โหลด
เวอร์ชัน 1.0, Apr 2025
Windows, Mac
5.0
รีวิว: 1
คำอธิบาย
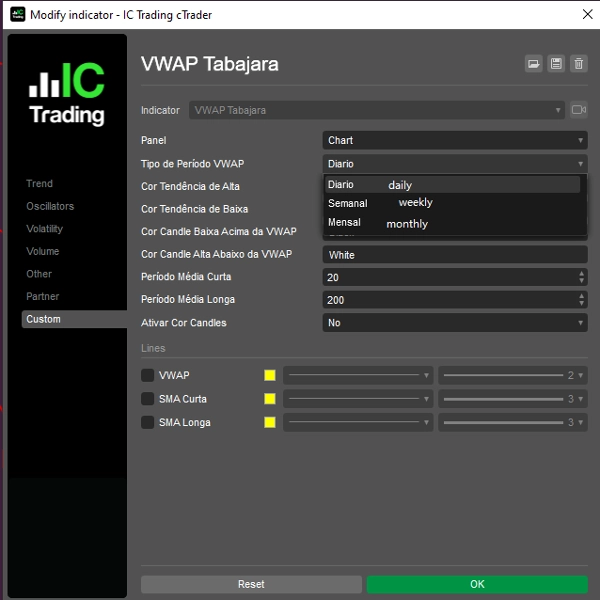
VWAP Tabajara
สรุป
สรุปโดย AI
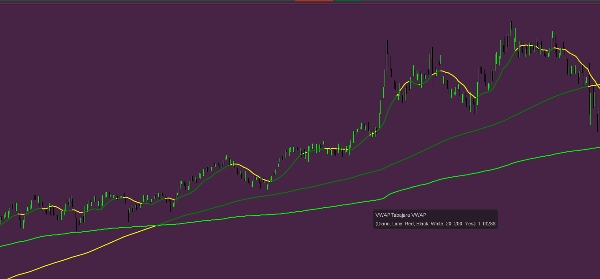
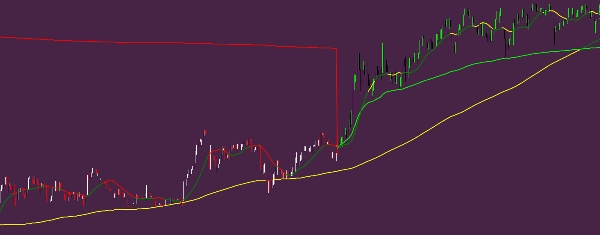
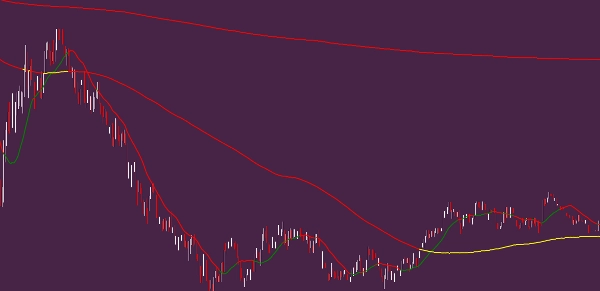
VWAP Tabajara is a trading indicator focused on the Volume Weighted Average Price (VWAP) metric. It provides traders with insights based on volume-weighted price data, which can be used to assess market trends and price levels. The indicator is designed to integrate into trading platforms, offering visual and analytical support for decision-making. VWAP Tabajara is categorized under volume indicators and is suitable for traders who utilize VWAP in their analysis.
โปรไฟล์อินดิเคเตอร์
รีวิวจากลูกค้า
5.0
รีวิว: 1
5 | 100 % | |
4 | 0 % | |
3 | 0 % | |
2 | 0 % | |
1 | 0 % |
รีวิวจากลูกค้า
August 12, 2025
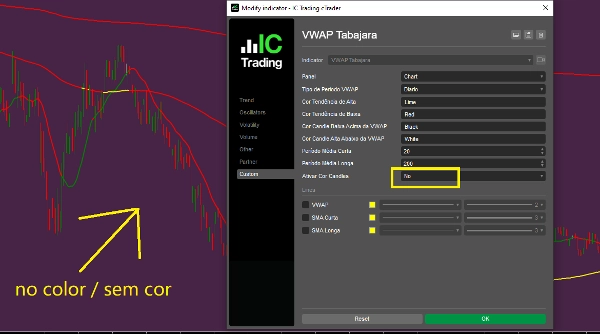
Pros: Accurate VWAP calculation with session reset, lightweight, stable on all timeframes. Great for intraday analysis. Cons: No alerts, no MTF mode, no preset saving.
การสนทนา
คำถามที่พบบ่อย
VWAP
ผลิตภัณฑ์ที่มีให้บริการผ่าน cTrader Store รวมถึงบอทการเทรด อินดิเคเตอร์ และปลั๊กอิน มีให้บริการโดยนักพัฒนาบุคคลที่สามและมีไว้เพื่อวัตถุประสงค์ในการเข้าถึงข้อมูลและทางเทคนิคเท่านั้น cTrader Store ไม่ใช่โบรกเกอร์และไม่ได้ให้คำแนะนำการลงทุน คำแนะนำส่วนบุคคล หรือการรับประกันผลการดำเนินงานในอนาคต
เพิ่มเติมจากผู้เขียนคนนี้


!["Tabajara corrigido[fix]" โลโก้](https://cdn.ctrader.com/image/webp/7f4bbef8-b245-4ebd-80d7-582fffc0c90c_28378)


ราคา
ตั้งแต่ 10/02/2025
1.26K
ติดตั้งฟรี