
PrevDayProjection
อินดิเคเตอร์
217 ดาวน์โหลด
เวอร์ชัน 1.0, Sep 2025
Windows, Mac
คำอธิบาย
ระดับการคาดการณ์ของวันก่อนหน้า
ปลดล็อกการเทรดที่แม่นยำด้วยการคาดการณ์ฟีโบนัชชีแบบไดนามิกตามการเคลื่อนไหวของราคาวานนี้
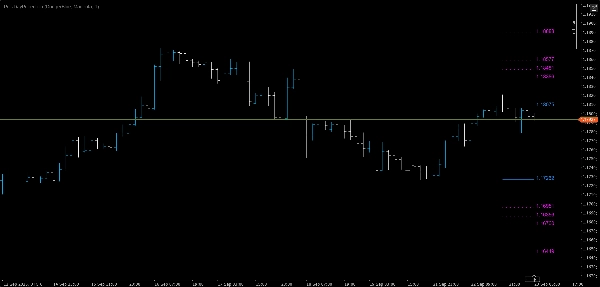
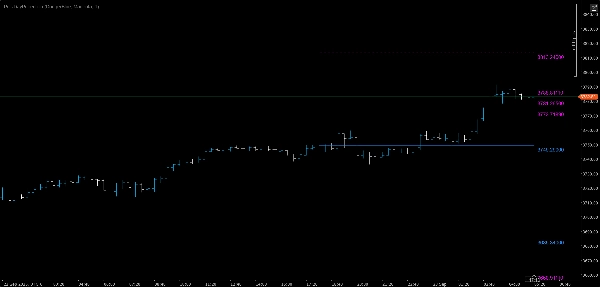
ตัวบ่งชี้นี้คำนวณโดยอัตโนมัติ ราคาสูงสุดและต่ำสุดของวันก่อนหน้า กำหนด ช่วงราคา แล้วจึงคาดการณ์ ระดับฟีโบนัชชีทั้งเหนือและใต้ ช่วงราคานั้น — มอบจุดอ้างอิงทันทีสำหรับแนวรับ แนวต้าน และโซนเบรกเอาท์ที่เป็นไปได้
คุณสมบัติหลัก
- 📅 การตรวจจับราคาสูงสุดและต่ำสุดของวันก่อนหน้าโดยอัตโนมัติ
- 📏 การคาดการณ์ฟีโบนัชชีตามช่วงราคา ที่ระดับ 38.2%, 50%, 61.8% และ 100%
- 🔼 เหนือราคาสูงสุดก่อนหน้า: สี่ระดับฟีโบนัชชีสำหรับเป้าหมายการต่อเนื่องขาขึ้น
- 🔽 ต่ำกว่าราคาต่ำสุดก่อนหน้า: สี่ระดับฟีโบนัชชีสำหรับเป้าหมายการต่อเนื่องขาลง
- 🎯 เส้นเฉพาะช่วง เริ่มจากแท่งแรกของวันนี้ — ไม่มีความรกบนกราฟ
- 🏷 ป้ายราคาที่ขอบขวา เพื่อการอ้างอิงอย่างรวดเร็วในพริบตา
- 🎨 สีและความหนาของเส้นที่ปรับแต่งได้เพื่อให้เข้ากับสไตล์กราฟของคุณ
ทำไมเทรดเดอร์ถึงชอบ
- แผนที่ชัดเจนสำหรับการเทรดภายในวัน: รู้ระดับสำคัญอย่างชัดเจนก่อนเริ่มเซสชัน
- การวิเคราะห์สองทิศทาง: วางแผนสำหรับการเคลื่อนไหวทั้งขึ้นและลง
- ประหยัดเวลาด้วยระบบอัตโนมัติ: ไม่ต้องวาดหรือคำนวณใหม่ด้วยตนเอง
- ใช้งานได้กับทุกช่วงเวลา: ตั้งแต่การสแคลป์ไปจนถึงการเทรดสวิง
เหมาะสำหรับ
- เทรดเดอร์รายวันที่มองหา เป้าหมายเบรกเอาท์ที่แม่นยำ
- เทรดเดอร์สวิงที่กำลังระบุ โซนรีเทรซเมนต์สำคัญ
- ใครก็ตามที่ใช้ ระดับฟีโบนัชชี เป็นส่วนหนึ่งของกลยุทธ์
💡 เคล็ดลับ: รวมตัวบ่งชี้นี้กับเครื่องมือโมเมนตัมหรือปริมาณที่คุณชื่นชอบเพื่อยืนยันการเข้าและออกในระดับที่คาดการณ์เหล่านี้
สรุป
สรุปโดย AI
PrevDayProjection is a technical indicator designed for trading platforms that automatically calculates the previous trading day’s high and low prices, determines the range, and projects Fibonacci levels based on that range. It generates key Fibonacci retracement and extension levels at 38.2%, 50%, 61.8%, and 100% both above the previous high and below the previous low. These levels serve as potential support, resistance, and breakout zones.
The indicator displays segment-only lines starting from the current day’s first bar to avoid chart clutter and includes price labels at the right edge for quick reference. Users can customize colors and line thickness to fit their chart style. It supports any timeframe, making it suitable for scalping, day trading, and swing trading.
PrevDayProjection is applicable across multiple markets including Forex, Indices, Commodities, and Crypto, with specific tags indicating symbols like EURUSD, XAUUSD (gold), and NAS100. It provides traders with a clear intraday roadmap and dual-direction analysis to plan for both bullish and bearish moves. The tool automates manual calculations, saving time and enhancing precision in identifying breakout targets and retracement zones.
โปรไฟล์อินดิเคเตอร์
รีวิวจากลูกค้า
0.0
รีวิว: 0
รีวิวจากลูกค้า
ยังไม่มีรีวิวสำหรับผลิตภัณฑ์นี้ หากเคยลองแล้ว ขอเชิญมาเป็นคนแรกที่บอกคนอื่น!
การสนทนา
คำถามที่พบบ่อย
Forex
Indices
EURUSD
Commodities
Crypto
XAUUSD
NAS100
ผลิตภัณฑ์ที่มีให้บริการผ่าน cTrader Store รวมถึงบอทการเทรด อินดิเคเตอร์ และปลั๊กอิน มีให้บริการโดยนักพัฒนาบุคคลที่สามและมีไว้เพื่อวัตถุประสงค์ในการเข้าถึงข้อมูลและทางเทคนิคเท่านั้น cTrader Store ไม่ใช่โบรกเกอร์และไม่ได้ให้คำแนะนำการลงทุน คำแนะนำส่วนบุคคล หรือการรับประกันผลการดำเนินงานในอนาคต


!["[Stellar Strategies] Smart ADX" โลโก้](https://cdn.ctrader.com/image/webp/af13b084-b6f6-41db-b7bc-c7e688b57b05_36929)


!["Smart Money Concepts (SMC) [Iridio Capital]" โลโก้](https://cdn.ctrader.com/image/webp/28b69fd1-ef54-4bed-9487-07e78e883be4_40934)


ราคา
26
การขาย
2.14K
ติดตั้งฟรี