
คำอธิบาย
🧠 ตัวบ่งชี้ช่องว่างมูลค่ายุติธรรม (FVG)
เปิดเผยความไม่สมดุลของตลาดที่ซ่อนอยู่ด้วยความแม่นยำ
ตัวบ่งชี้ช่องว่างมูลค่ายุติธรรม (FVG) เป็นเครื่องมือที่ทรงพลังสำหรับนักเทรดที่ใช้การเคลื่อนไหวของราคาเพื่อระบุและใช้ประโยชน์จากความไม่มีประสิทธิภาพระยะสั้นที่เกิดจากกระแสคำสั่งของสถาบันที่รุนแรง สร้างขึ้นบนตรรกะ 3 แท่งเทียนที่แข็งแกร่ง มันจะตรวจจับโซน FVG ขาขึ้นและขาลงโดยอัตโนมัติ—พื้นที่ที่ราคาสามารถกลับมาได้ก่อนที่จะดำเนินแนวโน้มต่อไป
🔍 คุณสมบัติหลัก
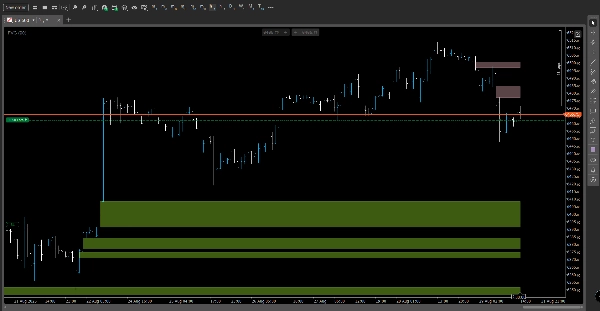
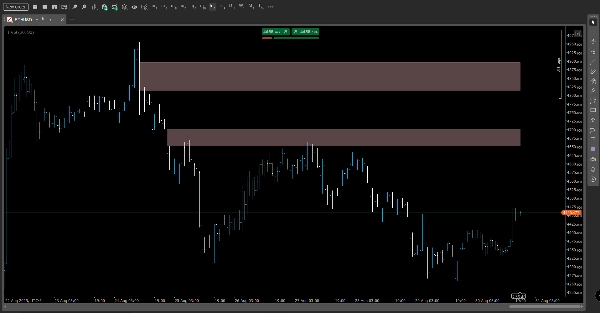
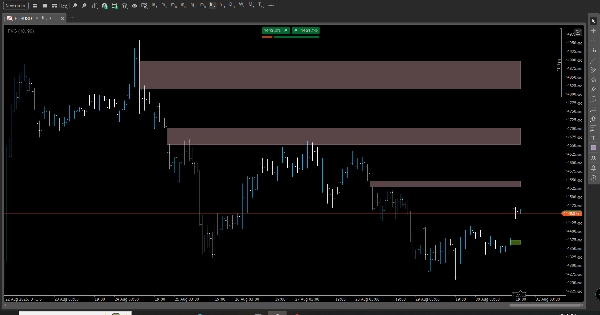
- การตรวจจับ FVG อัตโนมัติ: เน้นโซนความไม่สมดุลโดยใช้สี่เหลี่ยมที่สะอาดและไม่รีเพนท์ตามช่องว่างของแท่งเทียน
- การติดตามการบรรเทา: ตรวจสอบเมื่อราคากลับมาเติมช่องว่าง อัปเดตภาพและบันทึกเหตุการณ์การบรรเทา
- การแสดงทับโซนที่ยังไม่บรรเทา: แสดง FVG ที่ใช้งานเป็นเส้นแนวนอนหนาเพื่อการอ้างอิงและวางแผนการเทรดอย่างรวดเร็ว
- การตั้งค่าธรณีประตูแบบปรับได้: เลือกโหมดตั้งค่าธรณีประตูแบบแมนนวลหรืออัตโนมัติเพื่อปรับความไวให้เหมาะกับตลาดที่ผันผวนหรือเงียบสงบ
- ภาพที่กำหนดเอง: กำหนดสี ความทึบแสง และความยาวการฉายภาพให้ตรงกับสไตล์การวิเคราะห์ของคุณ
- การบันทึกในเทอร์มินัล: บันทึกแบบกะทัดรัดรายงานจำนวนช่องว่างทั้งหมด การบรรเทา และโซนที่ใช้งาน—เหมาะสำหรับการตรวจสอบกลยุทธ์
🎯 ประโยชน์
- การอ้างอิงการเทรดที่ชัดเจน: ใช้โซน FVG เป็นเป้าหมายการกลับตัว พื้นที่ปฏิกิริยา หรือการรวมตัวกับแนวคิดสมาร์ทมันนี่อื่นๆ
- รอยเท้าทางสายตาต่ำ: การออกแบบที่สะอาดช่วยให้กราฟของคุณอ่านง่ายในขณะที่รักษาบริบทความไม่สมดุลที่จำเป็น
- การทดสอบย้อนหลังที่เชื่อถือได้: ตรรกะแท่งปิดช่วยให้สัญญาณมีเสถียรภาพโดยไม่รีเพนท์
- พร้อมสำหรับหลายกรอบเวลา: เหมาะสำหรับนักเก็งกำไร นักเทรดสวิง และนักวิเคราะห์สไตล์สถาบัน
👤 เหมาะสำหรับใคร
- นักเทรดสมาร์ทมันนี่ & ICT
- นักเทรดที่ยึดมั่นในราคาแอคชัน
- นักวิเคราะห์เชิงปริมาณที่ตรวจสอบปฏิกิริยากระแสคำสั่ง
- นักเทรดที่มองหาจุดเข้าที่มีความน่าจะเป็นสูงตามโครงสร้างตลาด
สรุป
สรุปโดย AI
The Fair Value Gap (FVG) Indicator is designed for price-action traders to identify short-term market imbalances caused by institutional order flow. It uses a 3-bar logic to automatically detect bullish and bearish FVG zones—price gaps where the market may return before continuing its trend. Key features include automated detection with non-repainting rectangles, mitigation tracking that updates when gaps are filled, and an overlay of active unmitigated zones for easy reference. Users can adjust sensitivity via manual or automatic threshold modes and customize visual elements such as colors and opacity. The indicator logs gap statistics and mitigation events in the terminal for strategy validation. It supports multi-timeframe analysis, making it suitable for scalpers, swing traders, and institutional-style analysts. The FVG Indicator provides clear trade reference points, a low visual footprint to maintain chart readability, and reliable backtesting signals based on closed-bar logic. It is intended for traders focused on smart money concepts, price action, and order-flow validation seeking high-probability entries aligned with market structure.
โปรไฟล์อินดิเคเตอร์
รีวิวจากลูกค้า
0.0
รีวิว: 0
รีวิวจากลูกค้า
ยังไม่มีรีวิวสำหรับผลิตภัณฑ์นี้ หากเคยลองแล้ว ขอเชิญมาเป็นคนแรกที่บอกคนอื่น!
การสนทนา
คำถามที่พบบ่อย
ผลิตภัณฑ์ที่มีให้บริการผ่าน cTrader Store รวมถึงบอทการเทรด อินดิเคเตอร์ และปลั๊กอิน มีให้บริการโดยนักพัฒนาบุคคลที่สามและมีไว้เพื่อวัตถุประสงค์ในการเข้าถึงข้อมูลและทางเทคนิคเท่านั้น cTrader Store ไม่ใช่โบรกเกอร์และไม่ได้ให้คำแนะนำการลงทุน คำแนะนำส่วนบุคคล หรือการรับประกันผลการดำเนินงานในอนาคต


ราคา
26
การขาย
2.14K
ติดตั้งฟรี