
Daily SD Levels - Indicator
Indikator
4 pembelian
Versi 1.0, Aug 2025
Windows, Mac
5.0
Ulasan: 1
Penerangan
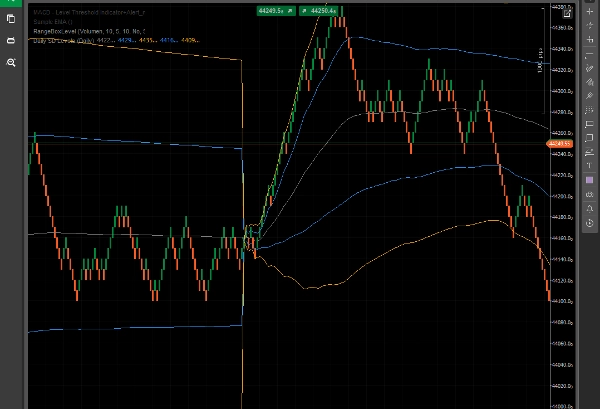
Tahap SD Harian – Jalur Sisihan Piawai Dinamik Berasaskan VWAP
Penunjuk Tahap SD Harian memplotkan VWAP (Harga Purata Berwajaran Isipadu) dan Jalur Sisihan Piawai (+1/+2 dan -1/-2) yang dikira sepanjang hari dagangan semasa.
Alat ini membantu pedagang menilai turun naik intrahari secara visual, potensi zon sokongan/rintangan, dan ekstrem harga, semuanya berdasarkan volum pasaran dan tindakan harga sebenar – bukan tahap tetap atau sewenang-wenangnya.
Ciri-ciri Utama:
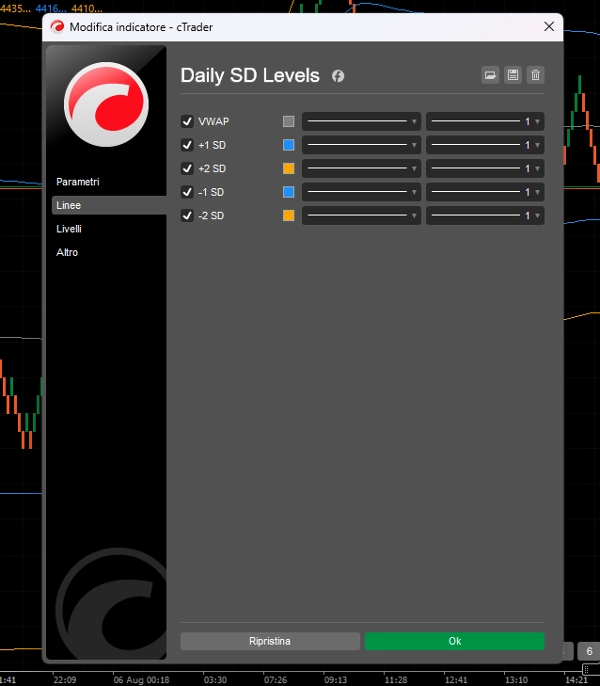
- Garis VWAP untuk menjejaki nilai adil intrahari.
- Jalur SD +1/+2 dan -1/-2 untuk mengenal pasti zon terlebih beli/terlebih jual.
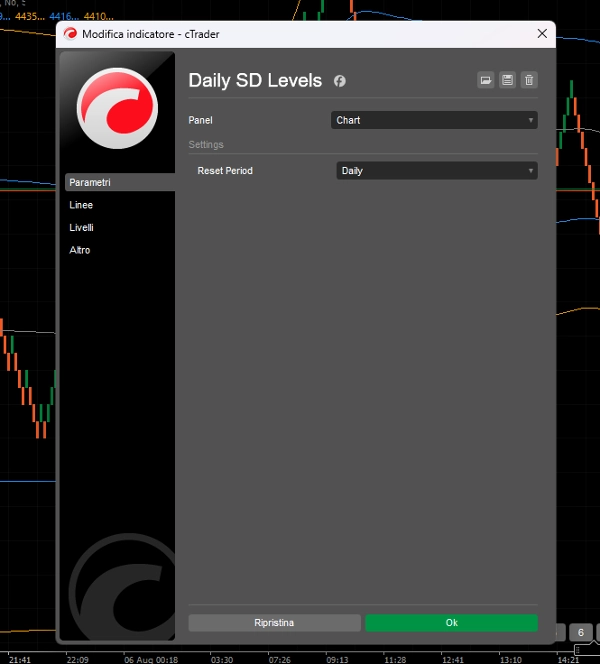
- Tahap diset semula setiap hari, menyesuaikan dengan dinamik harga dan volum setiap sesi.
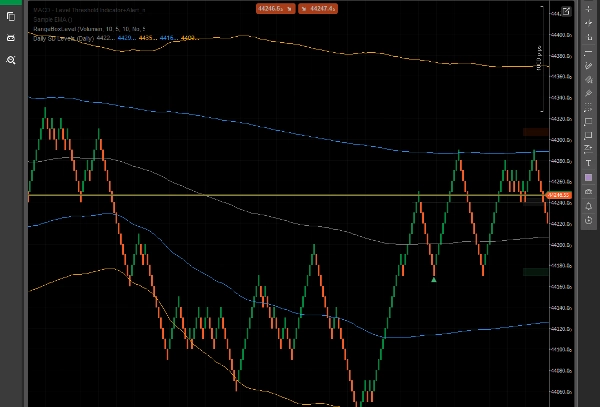
- Dioptimumkan untuk Renko, Bar Julat, dan Dagangan Intrahari.
- Dibina untuk pedagang yang memerlukan kejelasan dan zon harga dinamik.
Penunjuk ini sesuai untuk:
- Persediaan pembalikan purata.
- Mengenal pasti pergerakan yang melampau untuk kemungkinan pembalikan.
- Pengesahan visual bagi pecahan melebihi sempadan statistik.
Tiada kekusutan. Hanya tahap yang bersih dan responsif yang bergerak bersama pasaran.
Ringkasan
Profil indikator
Ulasan pelanggan
5.0
Ulasan: 1
5 | 100 % | |
4 | 0 % | |
3 | 0 % | |
2 | 0 % | |
1 | 0 % |
Ulasan pelanggan
August 8, 2025
it gives context without making the decision, but the chart still needs a human read.
Perbincangan
Soalan Lazim
Produk yang tersedia melalui cTrader Store, termasuk bot dagangan, indikator dan plugin, disediakan oleh pembangun pihak ketiga dan diberikan akses untuk tujuan maklumat dan teknikal sahaja. cTrader Store bukan broker dan tidak memberikan nasihat pelaburan, syor peribadi atau sebarang jaminan prestasi masa hadapan.


Harga
Sejak 16/07/2025
5
Jualan