Penerangan
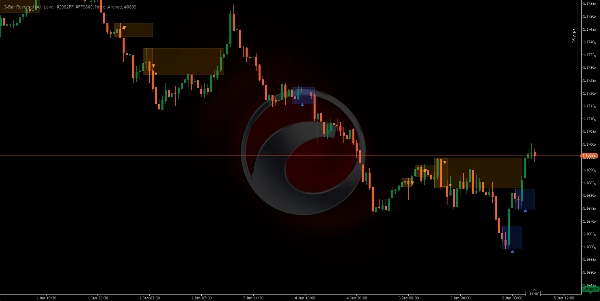
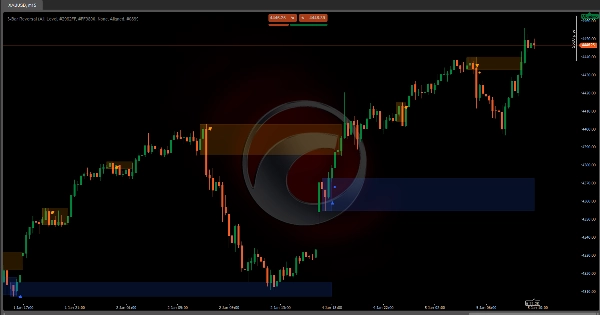
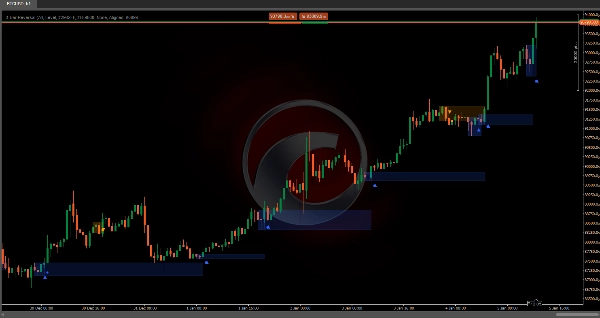
3-Bar Reversal
📊 APA ITU?
The 3-Bar Reversal adalah penunjuk teknikal yang mengenal pasti corak pembalikan tertentu yang dibentuk oleh tepat tiga lilin berturut-turut. Corak klasik ini memberi isyarat perubahan potensi dalam arah harga melalui struktur visual yang jelas: lilin tren, lilin keletihan, dan lilin pembalikan.
🎯 APA FUNGSI IA?
Penunjuk ini membantu pedagang untuk:
- Mengesan pembalikan bullish dan bearish dengan struktur 3-lilin
- Menapis isyarat palsu melalui pengesahan tren yang boleh dikonfigurasi
- Mengenal pasti zon sokongan dan rintangan berdasarkan corak yang disahkan
- Memvisualisasikan peluang perdagangan dengan penanda carta yang intuitif
- Melakukan perdagangan pembalikan berkemungkinan tinggi pada mana-mana jangka masa
🔍 BAGAIMANA IA BERFUNGSI?
Corak Bullish (3-Bar Bullish Reversal)
Struktur tiga lilin:
- Lilin 1 (Bearish): Tutup di bawah buka - mengesahkan tekanan jualan
- Lilin 2 (Bearish keletihan): Membuat paras rendah baru DAN paras tinggi baru di bawah lilin 1, dengan penutupan bearish - isyarat kapitulasikan ⚠️
- Lilin 3 (Pembalikan bullish): Tutup di atas buka DAN tinggi di atas tinggi lilin 1 - mengesahkan peralihan kawalan ✅
Corak Bearish (3-Bar Bearish Reversal)
Struktur bertentangan:
- Lilin 1 (Bullish): Tutup di atas buka - mengesahkan tekanan pembelian
- Lilin 2 (Bullish lanjutan): Membuat paras tinggi baru DAN paras rendah baru di atas lilin 1, dengan penutupan bullish - isyarat keterlaluan ⚠️
- Lilin 3 (Pembalikan bearish): Tutup di bawah buka DAN rendah di bawah rendah lilin 1 - mengesahkan peralihan kawalan ✅
Sistem Pengurusan Visual (Mesin Keadaan)
Penunjuk memproses setiap corak dalam tiga fasa berturut-turut:
FASE 1 - PENGESANAN CORAK: 🔍
- Struktur lengkap 3-lilin dikenalpasti
- A penunjuk segitiga (▲ bullish / ▼ bearish) muncul pada lilin ketiga
- A segi empat persediaan separa telus dilukis meliputi:
-
- Bullish: Dari tinggi lilin 1 ke rendah terendah (lilin 2 atau 3)
- Bearish: Dari rendah lilin 1 ke tinggi tertinggi (lilin 2 atau 3)
- Segi empat ini menandakan "zon pertempuran" di mana pembalikan berlaku
FASE 2 - PENGESAHAN ATAU PEMBATALAN: ⏳
Sistem menunggu lilin seterusnya selepas corak untuk mengesahkannya:
Pengesahan Bullish: ✅
- Penutupan lilin seterusnya mesti melebihi tinggi lilin 1 (siling segi empat)
- A titik pepejal (●) muncul menandakan pengesahan
- Segi empat menjadi zon sokongan aktif
Pengesahan Bearish: ✅
- Penutupan lilin seterusnya mesti memecah rendah lilin 1 (lantai segi empat)
- A titik pepejal (●) muncul menandakan pengesahan
- Segi empat menjadi zon rintangan aktif
Pembatalan: ❌
- Bullish gagal jika: tutup di bawah minimum segi empat ATAU corak bearish muncul
- Bearish gagal jika: tutup di atas maksimum segi empat ATAU corak bullish muncul
- Segi empat berhenti melanjutkan (corak mati)
Lanjutan Menunggu: ⏸️
- Jika tiada pengesahan atau kegagalan, segi empat melanjut secara mendatar lilin demi lilin
FASE 3 - ZON SOKONGAN/RINTANGAN AKTIF: 🎯
- Setelah disahkan, zon melanjut tanpa had ke kanan
- Zon Bullish: Kekal aktif selagi harga berada di atas lantai
- Zon Bearish: Kekal aktif selagi harga berada di bawah siling
- Zon tidak aktif apabila harga memecahkannya sepenuhnya ke arah bertentangan
⚙️ KONFIGURASI UTAMA
Mod Corak
Mengawal variasi corak yang diterima:
- Normal: Hanya menerima apabila lilin 3 ditutup DI DALAM julat lilin 1
-
- Bullish: Tutup < tinggi lilin 1 (pembalikan sederhana)
- Bearish: Tutup > rendah lilin 1 (pembalikan sederhana)
- Dipertingkatkan: Hanya menerima apabila lilin 3 ditutup DI LUAR julat lilin 1 🔥
-
- Bullish: Tutup > tinggi lilin 1 (pembalikan eksplosif)
- Bearish: Tutup < rendah lilin 1 (pembalikan eksplosif)
- Semua (Disyorkan): Menerima kedua-dua jenis tanpa pengecualian ⭐
Jenis Sokongan/Rintangan
- Tahap: Fungsi garis asas (terhad dalam versi ini)
- Zon: Melukis segi empat berteduh menandakan zon SR selepas pengesahan 📦
- Tiada: Tiada zon SR, hanya menunjukkan corak yang dikesan
Warna Boleh Disesuaikan 🎨
- Warna Pembalikan Bullish: Untuk segitiga, segi empat dan zon bullish (default:
#2962FF- biru) - Warna Pembalikan Bearish: Untuk segitiga, segi empat dan zon bearish (default:
#FF9800- oren) - Warna Tren Bullish: Untuk visualisasi penapis tren (default:
#089981- hijau) - Warna Tren Bearish: Untuk visualisasi penapis tren (default:
#F23645- merah)
🔧 PENAPIS TREN
Penunjuk boleh menapis corak berdasarkan arah tren keseluruhan menggunakan empat kaedah:
1. Awan Purata Bergerak ☁️
Menggunakan dua purata bergerak untuk mengenal pasti tren:
Parameter:
- Jenis Purata Bergerak: Mudah, Eksponen, Hull, Berwajaran, dll. (default: Hull)
- Tempoh Pantas: 50 (default)
- Tempoh Perlahan: 200 (default)
Logik Penapis (Selari):
- Tren bullish dikesan apabila: Harga > MA Pantas DAN MA Pantas > MA Perlahan ✅
- Tren bearish dikesan apabila: Harga < MA Pantas DAN MA Pantas < MA Perlahan ✅
- Hanya menunjukkan corak bullish dalam tren bullish dan corak bearish dalam tren bearish
Logik Bertentangan (Bertentangan):
- Membalikkan syarat untuk menangkap pembalikan utama melawan tren
2. Supertrend 📈
Penunjuk mengikuti tren berdasarkan volatiliti (ATR):
Parameter:
- Tempoh ATR: 10 (default) - tetingkap pengiraan volatiliti
- Faktor Pendaraban: 3.0 (default) - kepekaan penunjuk
Logik:
- Mengira jalur atas dan bawah menggunakan ATR
- Harga di atas Supertrend = tren bullish 🟢
- Harga di bawah Supertrend = tren bearish 🔴
- Menapis corak mengikut penjajaran yang dikonfigurasi
3. Saluran Donchian 📊
Menggunakan ekstrem harga sepanjang tempoh:
Parameter:
- Panjang Saluran: 13 (default)
Logik:
- Saluran atas = tinggi tertinggi bagi N tempoh
- Saluran bawah = rendah terendah bagi N tempoh
- Titik tengah = (atas + bawah) / 2
- Harga di atas titik tengah = tren bullish 🟢
- Harga di bawah titik tengah = tren bearish 🔴
4. Tiada (Tiada Penapis) 🔓
Menunjukkan SEMUA corak 3-bar yang dikesan tanpa mengambil kira tren keseluruhan. Berguna untuk:
- Pasaran terikat julat
- Analisis corak tulen
- Perdagangan pembalikan dalam mana-mana konteks
Penjajaran Tren
Digunakan apabila penapis aktif:
- Selari: Hanya menunjukkan corak yang SEIRING dengan tren yang dikenal pasti ➡️
-
- Corak bullish hanya dalam tren bullish
- Corak bearish hanya dalam tren bearish
- Bertentangan: Hanya menunjukkan corak yang MENENTANG tren yang dikenal pasti 🔄
-
- Corak bullish dalam tren bearish (pembalikan utama)
- Corak bearish dalam tren bullish (pembalikan utama)
Ringkasan
It operates in three phases: pattern detection, confirmation or invalidation based on the next candle's behavior, and establishing active support or resistance zones that extend while price respects them. The indicator supports configurable pattern modes (Normal, Enhanced, or All) to control acceptance criteria for reversals.
Trend filtering is available through four methods—Moving Average Cloud, Supertrend, Donchian Channels, or no filter—allowing users to align pattern signals with overall market trends or capture counter-trend reversals. Confirmed reversal zones are displayed as shaded rectangles or levels, customizable in color for bullish and bearish signals, trend filters, and zones.
This tool is designed for use on any timeframe and across various markets, including forex pairs (EURUSD, GBPUSD, USDJPY, NZDUSD), commodities (XAUUSD), indices (NAS100), and cryptocurrencies (BTCUSD). It aids traders in detecting high-probability reversals, filtering false signals, and identifying support and resistance zones with clear visual markers.