คำอธิบาย
ค่าเฉลี่ยเคลื่อนที่ Tillson T3 (Adaptive Smoother)
ภาพรวม:
Tillson T3 เป็นค่าเฉลี่ยเคลื่อนที่รุ่นถัดไปที่ออกแบบมาเพื่อให้ ความนุ่มนวลเป็นพิเศษพร้อมกับความล่าช้าที่น้อยที่สุด แตกต่างจาก SMA หรือ EMA แบบดั้งเดิม T3 ใช้การเฉลี่ยเลขชี้กำลังแบบต่อเนื่องผสมกับปัจจัยปริมาณที่ปรับแต่งได้ ทำให้เทรดเดอร์ได้เส้นที่ทั้งลื่นไหลและตอบสนองได้ดี เหมาะอย่างยิ่งสำหรับการระบุแนวโน้ม กรองเสียงรบกวน และทำให้ตัวชี้วัดอื่น ๆ นุ่มนวลขึ้น
คุณสมบัติหลัก:
• ⚡ ลดความล่าช้า: ตอบสนองต่อการเปลี่ยนแปลงราคารวดเร็วกว่า SMA/EMA ในขณะที่หลีกเลี่ยงสัญญาณผิดพลาด
• 🎯 เส้นโค้งที่นุ่มนวลอย่างยิ่ง: กรองเสียงรบกวนในตลาด ทำให้ทิศทางแนวโน้มชัดเจนขึ้น
• 🔧 ปัจจัยปริมาณที่ปรับแต่งได้: ปรับความตอบสนองเทียบกับความนุ่มนวล (0.3–0.9)
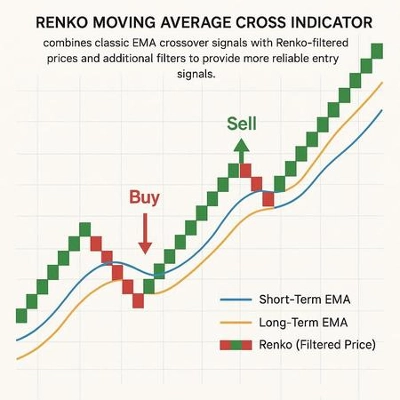
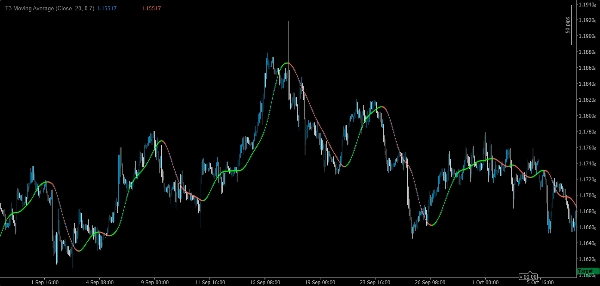
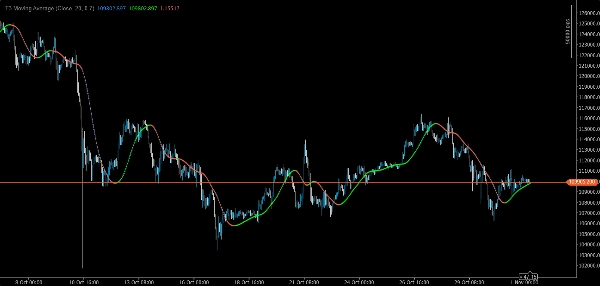
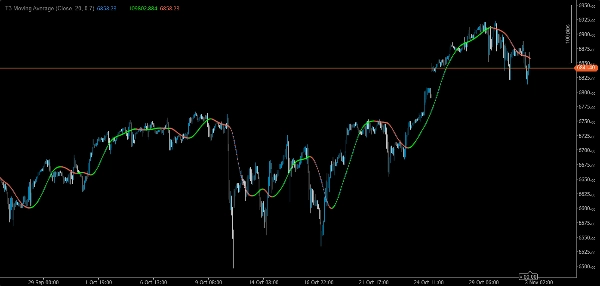
• 📊 ความชัดเจนทางสายตา: เฟสขึ้นและลงถูกเน้นด้วยจุดที่มีสีแตกต่างกัน
• 🔄 การใช้งานที่หลากหลาย: ใช้เป็นตัวกรองแนวโน้มเดี่ยว, ฐานสำหรับ trailing stops หรือเป็นตัวทำให้ oscillator อย่าง RSI/MACD นุ่มนวลขึ้น
• 🛠️ ปรับแต่งสำหรับ cTrader: น้ำหนักเบา, ไม่ทาสีซ้ำ และเข้ากันได้กับหลายกรอบเวลา
ทำไมต้องเลือกตัวชี้วัดนี้?
T3 ถือเป็นหนึ่งในเทคนิคการทำให้เรียบที่มีประสิทธิภาพที่สุดในการวิเคราะห์ทางเทคนิค ช่วยให้เทรดเดอร์อยู่ในแนวโน้มที่มีกำไรได้นานขึ้น หลีกเลี่ยงสัญญาณผิดพลาดในตลาดที่ผันผวน และปรับตัวเข้ากับสไตล์การเทรดที่แตกต่างกัน ไม่ว่าคุณจะเป็น scalper, swing trader หรือผู้พัฒนาระบบ T3 ก็ให้ความได้เปรียบที่เชื่อถือได้
เหมาะสำหรับ:
• เทรดเดอร์ที่ต้องการตัวกรองแนวโน้มที่มีความล่าช้าน้อย
• นักพัฒนาที่ต้องการตัวทำให้เรียบแบบโมดูลสำหรับกลยุทธ์ที่กำหนดเอง
• ใครก็ตามที่ต้องการตัวชี้วัดระดับมืออาชีพที่ทำงานได้ดีกว่าค่าเฉลี่ยมาตรฐาน
สรุป
Key features include faster reaction to price changes while minimizing false signals, visual clarity through color-coded points indicating rising and falling phases, and versatile applications such as standalone trend filtering, baseline for trailing stops, or smoothing other oscillators like RSI and MACD. The indicator is optimized for the cTrader platform, ensuring lightweight performance, non-repainting behavior, and compatibility across multiple timeframes.
The T3 Moving Average supports a wide range of markets including forex pairs (EURUSD, GBPUSD), cryptocurrencies (BTCUSD), indices (NAS100, US 500), commodities (XAUUSD), and stocks. It is suitable for various trading styles, from scalping to swing trading, and for developers seeking a modular smoother for custom strategies.