
คำอธิบาย
Support & Resistance Pro ระบุโซนแนวรับและแนวต้าน และ — แตกต่างจากเครื่องมือ S/R ส่วนใหญ่ — วัดว่าโซนเหล่านั้นใช้งานได้จริงหรือไม่ โดยใช้เครื่องมือสถิติอิสระที่สร้างขึ้นจากข้อมูลประวัติศาสตร์จริงแทนการสมมติ ทุกโซนแสดงสถิติอัตราการยึดถือพร้อมช่วงความเชื่อมั่น ซึ่งคำนวณจากประชากรโซนประวัติศาสตร์ทั้งหมด รวมถึงโซนที่ต่อมาถูกทำลายและหายไปจากแผนภูมิ ตัวบ่งชี้ส่วนใหญ่ในหมวดนี้นับเฉพาะระดับที่ยังเห็นได้ในปัจจุบัน ซึ่งทำให้การอ้างความแข็งแกร่งถูกขยายโดยเงียบๆ เครื่องมือนี้ไม่เป็นเช่นนั้น
คุณสมบัติหลัก
- โซนที่ได้รับการตรวจสอบทางสถิติ ทุกโซนมีอัตราการยึดถือที่วัดได้จริงจากประวัติศาสตร์พร้อมช่วงความเชื่อมั่น 95% — ไม่ใช่คะแนนความแข็งแกร่งที่สมมติ สัญญาณหนึ่งคือการปฏิเสธไส้เทียนที่จุดสัมผัส ซึ่งได้รับการตรวจสอบอย่างเป็นทางการ: ยืนยันบน EURUSD และ Bitcoin ในหลายกรอบเวลา รวมถึงการทดสอบนอกตัวอย่างจริงที่ผลยังคงแข็งแกร่งในข้อมูลที่ไม่เคยเห็นมาก่อน
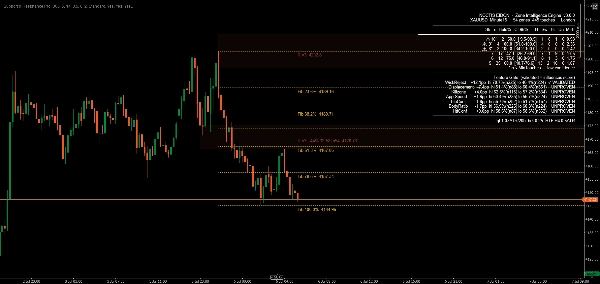
- การสลับบทบาทอัตโนมัติ แนวรับที่ถูกทำลายจะกลายเป็นแนวต้านโดยอัตโนมัติ และในทางกลับกัน พร้อมเครื่องหมายภาพที่ชัดเจน — ตัวบ่งชี้ติดตามว่าราคาอยู่ฝั่งใดของโซนและระบายสีตามนั้น แทนที่จะกำหนดสีตามวิธีที่โซนก่อตัวขึ้นเดิม
- การรวมกันของกรอบเวลาที่สูงกว่า โซนบนแผนภูมิของคุณจะถูกตรวจสอบกับกรอบเวลาที่สูงกว่าที่คุณเลือก โดยโครงสร้าง HTF ที่ตรงกันจะถูกวาดโดยตรงบนแผนภูมิเป็นภาพซ้อนแยกต่างหาก
- การรวมระดับ Fibonacci Retracement ระดับ Fibonacci retracement อัตโนมัติจากสวิงล่าสุด แต่ละระดับติดป้ายทั้งอัตราส่วนและราคาที่แม่นยำตามความละเอียดของโบรกเกอร์ของคุณ จัดระเบียบโดยอัตโนมัติเพื่อไม่ให้ป้ายทับซ้อนกับโซนใกล้เคียง
- คำเตือนความอิ่มตัว โซนที่ถูกทดสอบบ่อยเกินไปจะถูกทำเครื่องหมายแทนที่จะสมมติว่าแข็งแกร่งกว่า — ข้อมูลของเราชี้ให้เห็นว่าโซนที่ถูกทดสอบหนักมักทำงาน แย่ลง ไม่ใช่ดีขึ้น ซึ่งน่าจะเป็นเพราะสภาพคล่องที่พักอยู่ถูกใช้ไปแล้ว
- ประตูตรวจสอบแบบเปิด สัญญาณผู้สมัครเพิ่มเติมหกรายการ — อัตราส่วนของแท่งเทียน, ความเร็วในการเข้าใกล้, เวลาช่วงเซสชัน/โซนฆ่า, และการทดสอบการเคลื่อนที่ — แสดงสดบนแผงสถิติในตัวพร้อมการอ่านอัตราการยึดถือของตัวเอง พวกมันไม่ส่งผลต่อคะแนนหรือการจัดอันดับจนกว่าทุกสัญญาณจะผ่านเกณฑ์เดียวกับการปฏิเสธไส้เทียน คุณจะเห็นอย่างชัดเจนว่าสิ่งใดได้รับการพิสูจน์แล้วและสิ่งใดยังไม่
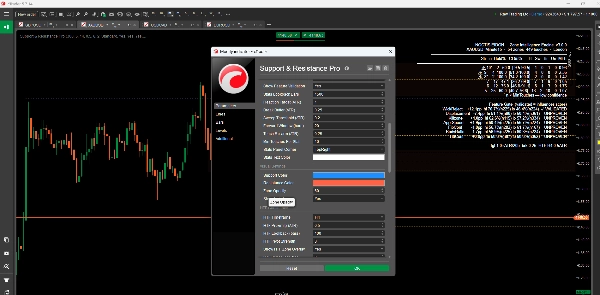
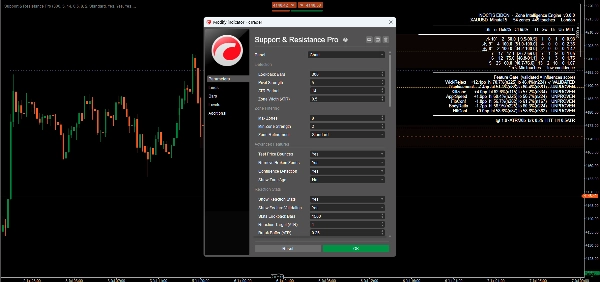
- การตั้งค่าที่ปรับแต่งได้ การควบคุมพารามิเตอร์อย่างกว้างขวางในด้านความไวในการตรวจจับ การกรองโซน สไตล์ภาพ และพฤติกรรมการแจ้งเตือน
- การแจ้งเตือนแบบเรียลไทม์ การแจ้งเตือนแบบป๊อปอัพ อีเมล และเสียงสำหรับการสัมผัสโซน การเบรกเอาท์ และเหตุการณ์การรวมกัน สามารถเปิดปิดได้แยกตามช่องทาง
ประโยชน์
- หลักฐานเหนือสมมติฐาน: ทุกสถิติบนแผนภูมิสามารถตรวจสอบได้อย่างอิสระ — ตัวบ่งชี้รวมเครื่องมือยืนยันในตัวทั้งในและนอกตัวอย่าง
- ไม่มีอคติจากการรอดชีวิต: การอ้างความแข็งแกร่งสร้างขึ้นจากประชากรโซนประวัติศาสตร์ทั้งหมด ไม่ใช่แค่ระดับที่รอดชีวิตมาได้
- การเปิดเผยอย่างซื่อสัตย์: สัญญาณที่ได้รับการพิสูจน์และยังไม่ได้รับการพิสูจน์ถูกติดป้ายไว้เช่นนั้นบนแผนภูมิอยู่เสมอ
เหมาะสำหรับ
เทรดเดอร์ที่ต้องการเห็นหลักฐานทางสถิติที่อยู่เบื้องหลังระดับ ไม่ใช่แค่เส้น — เทรดเดอร์รายวัน เทรดเดอร์สวิง และเทรดเดอร์ระบบในตลาดฟอเร็กซ์ คริปโต และเครื่องมืออื่นๆ ที่ต้องการวิธีการวัดอย่างเข้มงวดสำหรับแนวรับและแนวต้าน
บทสรุป
Support & Resistance Pro สร้างขึ้นบนหลักการหนึ่งข้อ: การอ้างความแข็งแกร่งไม่ใช่เรื่องจริงจนกว่าจะมีการวัด สัญญาณหนึ่งผ่านเกณฑ์นั้นด้วยการยืนยันข้ามเครื่องมือ ข้ามกรอบเวลา และนอกตัวอย่าง ส่วนที่เหลือแสดงอย่างซื่อสัตย์ว่ายังอยู่ระหว่างการทดสอบ — เพราะตัวเลขที่คุณไม่สามารถตรวจสอบได้ไม่ควรแสดงเลย
สรุป
- Dynamic support and resistance levels that adjust in real-time based on recent price action.
- Multi-timeframe analysis to view levels across different timeframes for a comprehensive market overview.
- Calculation and display of pivot points to mark potential intraday reversal zones and target prices.
- Highlighting of psychological price levels (round numbers) to gauge market sentiment.
- Integration of Fibonacci retracement levels to assist in identifying support and resistance during price corrections.
- Customizable settings for lookback periods, visualization styles, and color schemes to suit individual trading preferences.
- Clear graphical representation for easy identification of market conditions.
- Configurable real-time alerts when prices approach critical levels.
This indicator supports various trading styles including scalping, day trading, and swing trading, and is suitable for traders in forex, commodities, stocks, and indices markets. It is intended for both beginner and experienced traders seeking structured market analysis and enhanced decision-making through reliable support and resistance data.
รีวิวจากลูกค้า
5 | 100 % | |
4 | 0 % | |
3 | 0 % | |
2 | 0 % | |
1 | 0 % |


!["[Hamster-Coder] Moving Average MTF" โลโก้](https://cdn.ctrader.com/image/webp/b11b98b1-194d-4b8e-b00e-d611826ad159_31226)


