
KaufmanEfficiencyRatio
อินดิเคเตอร์
78 ดาวน์โหลด
เวอร์ชัน 1.0, Sep 2025
Windows, Mac
⚡ Kaufman Efficiency Ratio (KER)
ความชัดเจนของแนวโน้ม ที่ถูกวัดอย่างแม่นยำ
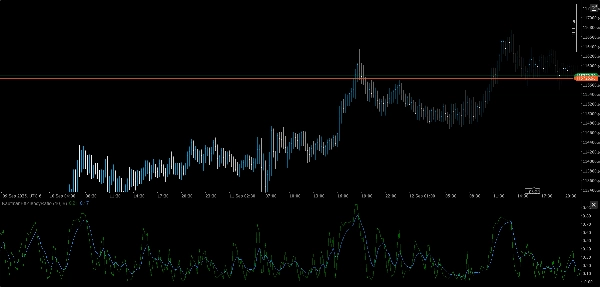
Kaufman Efficiency Ratio (KER) เป็นเครื่องมือที่แม่นยำสำหรับวัดว่าราคาขยับจากจุด A ไป B อย่างมีประสิทธิภาพเพียงใด—โดยไม่หลงทางในเสียงรบกวน ไม่ว่าคุณจะกำลังตรวจสอบเงื่อนไขการเบรคเอาท์หรือกรองการแกว่งตัวด้านข้าง KER จะให้คะแนนที่ชัดเจนระหว่าง 0 ถึง 1 ซึ่งสะท้อนเจตนาทิศทางเทียบกับความผันผวน
🔍 สิ่งที่มันทำ
- คำนวณ Kaufman’s Efficiency Ratio:
- แสดงค่าที่ปรับมาตรฐานจาก 0 (เสียงรบกวนบริสุทธิ์) ถึง 1 (แนวโน้มที่สมบูรณ์แบบ)
- เน้นย้ำระหว่างสภาวะแนวโน้มและไม่แนวโน้มโดยไม่มีความกำกวม
- เหมาะสำหรับการซ้อนทับแบบปรับตัว, ตัวกรองสภาวะ, และการควบคุมสัญญาณ
🛠️ คุณสมบัติหลัก
- ตัวจัดการอินพุตแบบโมดูลาร์สำหรับแหล่งข้อมูลหลายกรอบเวลา
- รองรับสินทรัพย์ข้ามประเภท: FX, crypto, ดัชนี, หุ้น
- ตรรกะน้ำหนักเบาแบบเรียลไทม์โดยไม่มีความล่าช้าจากการปรับเรียบ
- เสียบใช้งานได้ทันทีร่วมกับสถาปัตยกรรมชุดเครื่องมือที่มีอยู่ของคุณ
🎯 กรณีการใช้งาน
- การยืนยันแนวโน้ม: ยืนยันความโน้มเอียงทิศทางก่อนการดำเนินการสัญญาณ
- การกรองเสียงรบกวน: ป้องกันการเข้าซื้อขายในช่วงที่ราคาขยับอย่างไม่มีประสิทธิภาพ
- การตรวจจับสภาวะ: ใช้ร่วมกับการซ้อนทับที่รับรู้ความผันผวนเพื่อการเปลี่ยนผ่านที่ชาญฉลาดขึ้น
- การสร้างกลยุทธ์: ใช้เป็นตัวชี้วัดหลักในตรรกะเบรคเอาท์, โมเมนตัม หรือความโน้มเอียง
💡 โบนัส
KER ฟรี เร็ว และมีประสิทธิภาพอย่างไร้ปรานี—เหมือนกับโค้ดของคุณ ไม่มีส่วนเกิน ไม่มีตัวกรอง มีเพียงเจตนาตลาดดิบที่กลั่นกรองแล้วเท่านั้น
โปรไฟล์อินดิเคเตอร์
0.0
รีวิว: 0
รีวิวจากลูกค้า
ยังไม่มีรีวิวสำหรับผลิตภัณฑ์นี้ หากเคยลองแล้ว ขอเชิญมาเป็นคนแรกที่บอกคนอื่น!
Breakout
Scalping
AI
ผลิตภัณฑ์ที่มีให้บริการผ่าน cTrader Store รวมถึงบอทการเทรด อินดิเคเตอร์ และปลั๊กอิน มีให้บริการโดยนักพัฒนาบุคคลที่สามและมีไว้เพื่อวัตถุประสงค์ในการเข้าถึงข้อมูลและทางเทคนิคเท่านั้น cTrader Store ไม่ใช่โบรกเกอร์และไม่ได้ให้คำแนะนำการลงทุน คำแนะนำส่วนบุคคล หรือการรับประกันผลการดำเนินงานในอนาคต


24
การขาย
2.09K
ติดตั้งฟรี