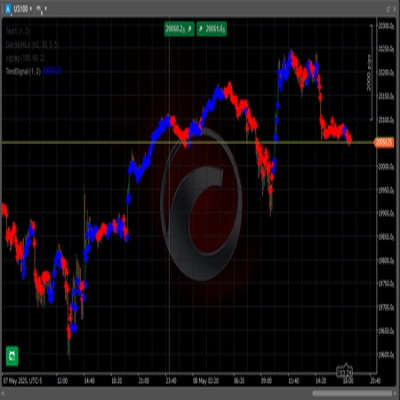
TendSignal_indicator
Indicatore
159 download
Versione 1.0, May 2025
Windows, Mac

Descrizione
Segnale di trend following
Riepilogo
Riepilogo AI
TendSignal_indicator is a trend-following signal indicator designed to assist traders by identifying market trends. It provides clear signals based on trend analysis to support decision-making in trading strategies. The product is categorized as a signal tool and is intended for use within trading platforms to enhance trend detection.
Profilo indicatore
Recensioni dei clienti
0.0
Recensioni: 0
Recensioni dei clienti
Questo prodotto non ha ancora ricevuto recensioni. L'hai già provato? Fallo sapere agli altri per primo!
Discussioni
Domande frequenti
Signal
I prodotti disponibili tramite cTrader Store, inclusi bot di trading, indicatori e plugin, sono forniti da sviluppatori terzi e resi disponibili esclusivamente a scopo informativo e di accesso tecnico. cTrader Store non è un broker e non fornisce consulenze in materia di investimento, raccomandazioni individualizzate o garanzie di risultati futuri.


Prezzo
Da 01/04/2025
240
Installazioni gratuite