
คำอธิบาย
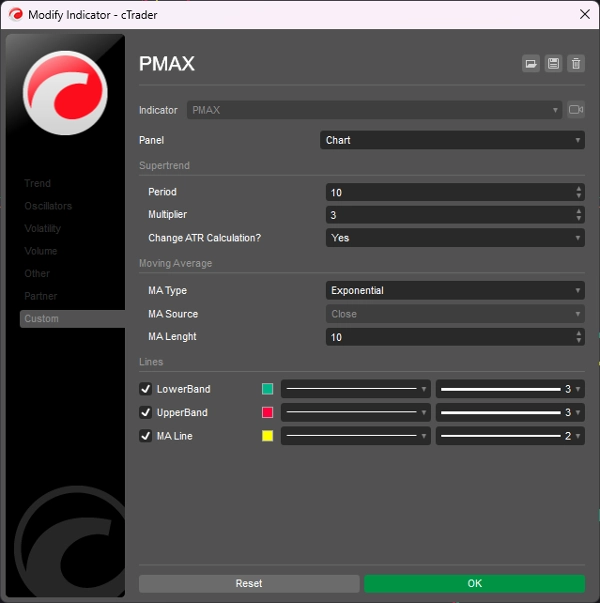
PMax (Profit Maximizer) เป็นตัวบ่งชี้ใหม่ที่พัฒนาโดย KivancOzbilgic ในช่วงต้นปี 2020
มันเป็นการรวมกันของตัวบ่งชี้ trailing stop loss สองตัว;
ตัวหนึ่งคือ MOST (Moving Stop Loss) ของ Anıl Özekşi และอีกตัวหนึ่งคือ SuperTrend ที่มีพื้นฐานจาก ATR ซึ่งเป็นที่รู้จักกันดี
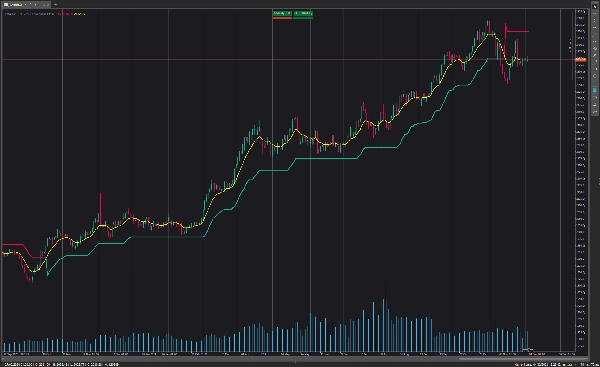
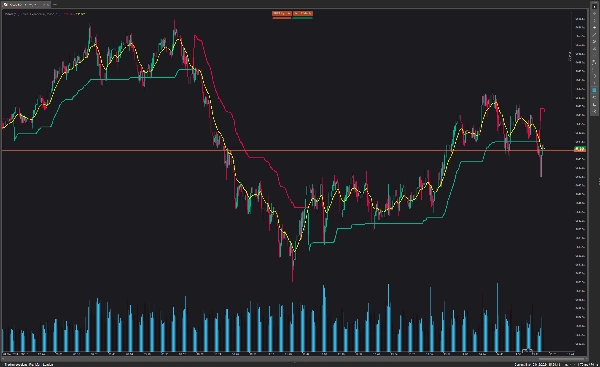
ทั้ง MOST และ SuperTrend เป็นตัวบ่งชี้ที่ดีมากสำหรับระบบติดตามแนวโน้ม แต่ในทางกลับกันประสิทธิภาพของพวกมันไม่โดดเด่นในสภาวะตลาดที่เคลื่อนไหวแบบด้านข้างเหมือนกับตัวบ่งชี้อื่นๆ ส่วนใหญ่
Profit Maximizer - PMax พยายามแก้ปัญหานี้ PMax รวมจุดแข็งของ MOST (Moving Average Trend Changer) และ SuperTrend (การตรวจจับราคาด้วย ATR) ไว้ในตัวบ่งชี้เดียวกัน
ผลการทดสอบย้อนหลังและการปรับแต่งของ PMax ดีกว่ามากเมื่อเทียบกับบรรพบุรุษของมันคือ MOST และ SuperTrend มันช่วยลดจำนวนสัญญาณเท็จในตลาดที่เคลื่อนไหวแบบด้านข้างและให้สัญญาณการเทรดที่น่าเชื่อถือมากขึ้น
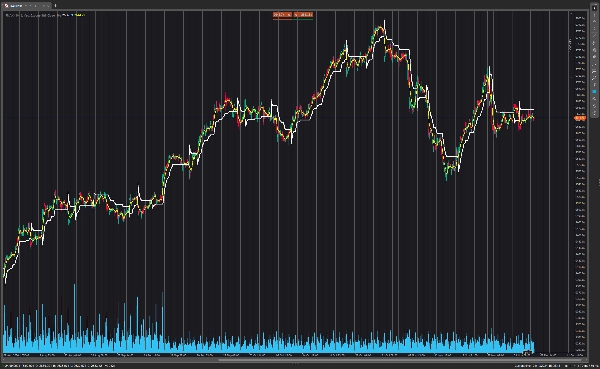
PMax ง่ายต่อการกำหนดแนวโน้มและสามารถใช้ได้กับตลาดและเครื่องมือทุกประเภท มันไม่ทำการ repaint
สรุป
This combination enhances trend identification and reduces false signals during non-trending market phases. Backtesting and optimization show that PMax outperforms its component indicators in reliability and signal accuracy. It is designed for use across various markets and instruments and does not repaint, providing consistent signals for traders.
รีวิวจากลูกค้า
5 | 100 % | |
4 | 0 % | |
3 | 0 % | |
2 | 0 % | |
1 | 0 % |


!["[CB] Pivot Points Pro" โลโก้](https://cdn.ctrader.com/image/webp/43463c82-67b0-4f10-a4ba-901bba091d81_32594)


