
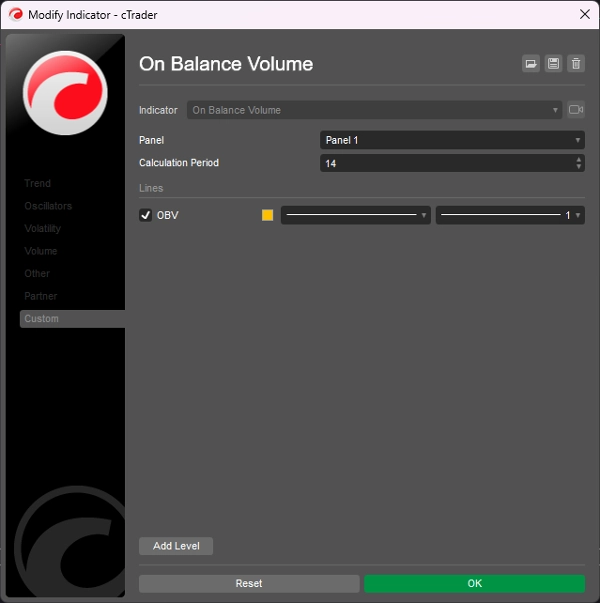
On Balance Volume
Indikator
247 muat turun
Versi 1.0, Dec 2024
Windows, Mac
5.0
Ulasan: 1
Penerangan
Isipadu Seimbang (OBV) mengukur tekanan pembelian dan penjualan sebagai penunjuk terkumpul yang menambah isipadu pada hari naik dan mengurangkan isipadu pada hari turun.
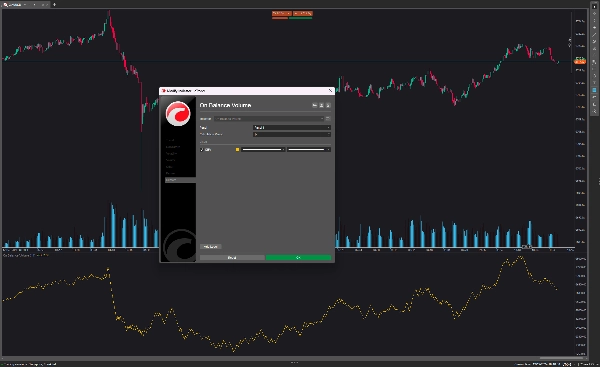
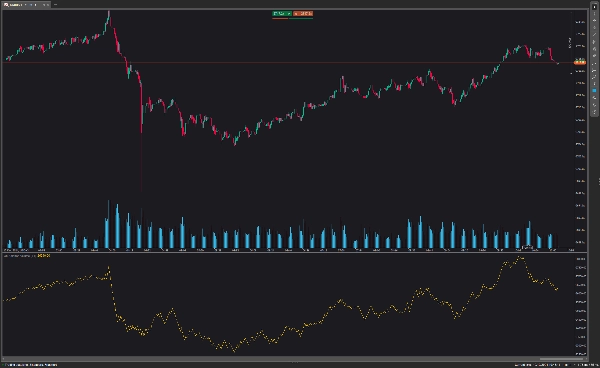
Isipadu Seimbang dipaparkan di bahagian bawah carta. Garis OBV naik apabila harga penutupan hari ini meningkat dan turun apabila harga penutupan semalam lebih tinggi daripada harga semasa.
Penunjuk OBV biasanya mengenal pasti pecahan sebelum garis harga dan membantu dalam menetapkan trend menaik yang jelas. Jika anda ingin berdagang dengan strategi ini, anda membuka posisi forex pada tahap harga pecahan dan meletakkan stop loss di atas ayunan tinggi terkini
Ringkasan
Ringkasan AI
On Balance Volume (OBV) is a technical indicator that measures buying and selling pressure by cumulatively adding volume on days when the closing price rises and subtracting volume on days when it falls. Displayed at the bottom of the chart, the OBV line moves upward when today's closing price exceeds the previous day's and moves downward when it is lower. This indicator is used to identify potential breakouts ahead of price movements and to confirm upward trends. Traders using OBV may open positions at breakout price levels and set stop losses above recent high swings. The indicator is applicable in forex markets and supports breakout trading strategies.
Profil indikator
Ulasan pelanggan
5.0
Ulasan: 1
5 | 100 % | |
4 | 0 % | |
3 | 0 % | |
2 | 0 % | |
1 | 0 % |
Ulasan pelanggan
August 18, 2025
Pros: A lightweight cumulative volume indicator that confirms price moves and detects divergences. Excellent for analyzing trend strength and sentiment. Cons: No alerts, tooltips, or template features. Signals may lag in volatile or manipulated markets.
Perbincangan
Soalan Lazim
Forex
Breakout
Produk yang tersedia melalui cTrader Store, termasuk bot dagangan, indikator dan plugin, disediakan oleh pembangun pihak ketiga dan diberikan akses untuk tujuan maklumat dan teknikal sahaja. cTrader Store bukan broker dan tidak memberikan nasihat pelaburan, syor peribadi atau sebarang jaminan prestasi masa hadapan.
Lebih banyak produk daripada penulis ini


![Logo "Smart Money Concepts (SMC) [Iridio Capital]"](https://cdn.ctrader.com/image/webp/28b69fd1-ef54-4bed-9487-07e78e883be4_40934)


Harga
2
Jualan
6.9K
Pemasangan percuma