الوصف
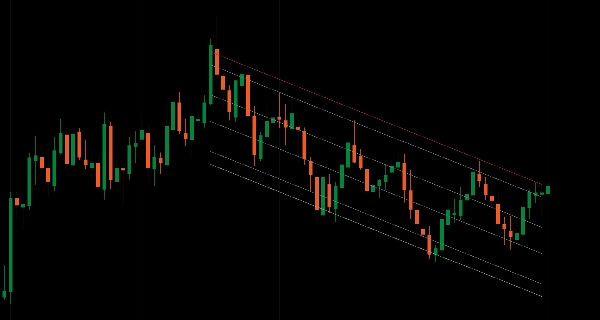
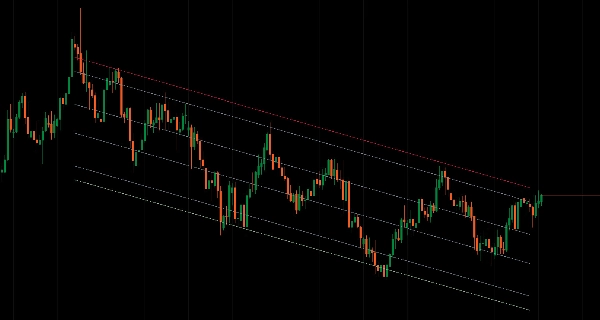
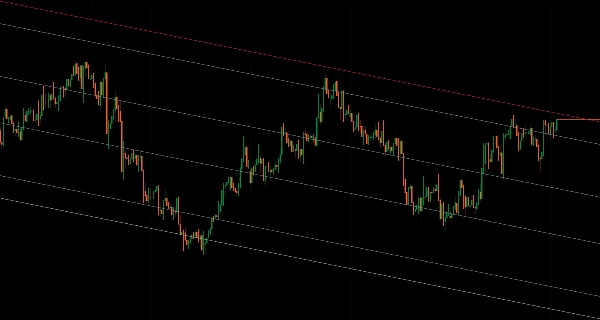
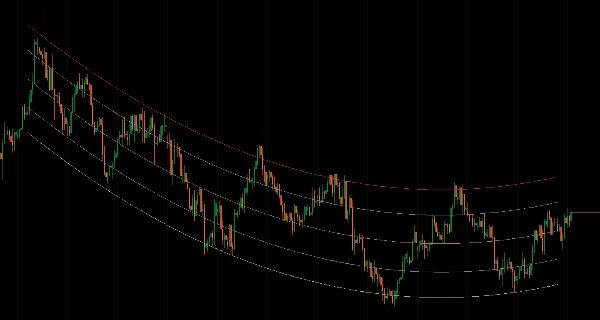
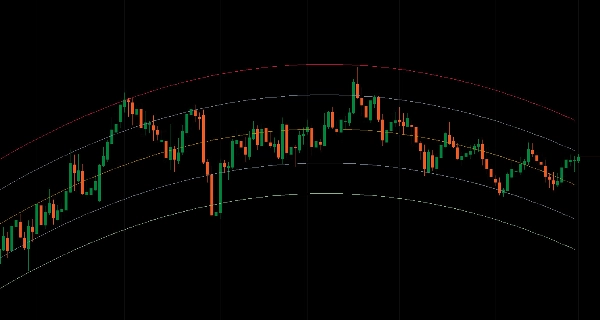
قنوات الانحدار الإحصائي مع مستويات فيبوناتشي عبر أنواع حساب متعددة، أطر زمنية، ونطاقات تاريخية.
يُناسب خطوط الانحدار عبر بيانات السعر باستخدام ثمانية طرق (خطي، لوغاريتمي، أُسّي، موزون، كثير الحدود، متحرك، متحرك أُسّي، LOWESS) مع نطاقات الانحراف المعياري لتحليل ارتداد المتوسط.
تسعة مستويات قناة فيبوناتشي (من 0% إلى 100%)، تحليل متعدد الأطر الزمنية عبر 16 فترة مع عرض مستخلص، ثلاث أوضاع حساب (معتمد على الفترة، نطاق التاريخ، MTF)، تحكم في درجة كثير الحدود (1-5) لهياكل الاتجاه المنحنية، مضاعف الانحراف المعياري لضبط عرض القناة، تحليل تاريخ ووقت مع مراعاة المنطقة الزمنية لتحليل الأحداث، تمديد خط الاتجاه إلى اللانهاية، وتخزين مؤقت LRU محسن لتقديم تحليل انحدار إحصائي شامل للمتداولين الذين يستهدفون مناطق ارتداد المتوسط والهياكل السعرية المنحنية عبر ظروف السوق.
الميزات
8 أنواع حساب الانحدار
- خطي: انحدار خطي كلاسيكي بأقل المربعات
- لوغاريتمي: انحدار قائم على اللوغاريتم الطبيعي للحركات السعرية الأسية
- أُسّي: ملاءمة منحنى أُسّي للاتجاهات المتسارعة
- موزون: انحدار خطي مع وزن أكبر للأشرطة الحديثة
- كثير الحدود: ملاءمات منحنية (درجة 1-5) للاتجاهات غير الخطية
- متحرك: انحدار قائم على المتوسط المتحرك
- متحرك أُسّي: انحدار قائم على EMA لتنعيم الاتجاه
- LOWESS: انحدار موزون محليًا للتنعيم التكيفي
9 مستويات قناة فيبوناتشي
- نطاق القناة الكامل: 100% (علوي)، 88.6%، 76.4%، 61.8%، 50% (الخط الأوسط)، 38.2%، 23.6%، 11.4%، 0% (سفلي)
- مناطق ارتداد المتوسط داخل نطاقات الانحدار
- نقاط مرجعية دقيقة للدعم/المقاومة
- تحكم مستقل في اللون/النمط/السماكة لكل مستوى
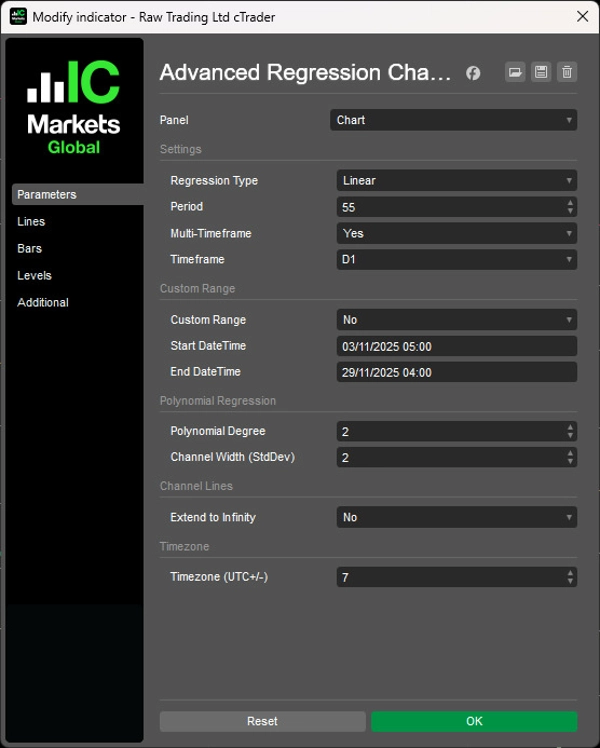
تحليل متعدد الأطر الزمنية
- حساب الانحدار على إطار زمني أعلى، العرض على الرسم البياني الحالي
- 16 إطارًا زمنيًا متاحًا (من m1 إلى شهري)
- قيم قناة مستخلصة للعرض السلس عبر أشرطة الرسم البياني
- هيكل إطار زمني أعلى دون تبديل الرسوم البيانية
3 أوضاع حساب
- معتمد على الفترة: نافذة متحركة من N أشرطة (افتراضي)
- نطاق التاريخ: تاريخ ووقت بداية/نهاية مخصص لأحداث أو مراحل محددة مع تحليل تاريخ ووقت مع مراعاة المنطقة الزمنية (إزاحة UTC+/-)
خيارات عرض القناة
- الإخراج القياسي: رسم جميع المستويات التسعة كخطوط مؤشر
- التمديد إلى اللانهاية: العرض كخطوط اتجاه تمتد إلى الأمام بلا حدود
- تحديث تلقائي عند تغيير الألوان/الأنماط
- عرض نظيف—لا توجد قيم متبقية خارج نافذة الحساب
وضع نطاق التاريخ
- تحديد تواريخ بداية/نهاية دقيقة (بتنسيق dd/MM/yyyy HH:mm)
- تحليل أحداث السوق أو المراحل أو الهيكل المحددة
- مستقل عن معلمة الفترة
- تحويل المنطقة الزمنية من وقت المستخدم المحلي إلى وقت الخادم
الحساب الديناميكي
- تحديثات في الوقت الحقيقي مع تكوين أشرطة جديدة
- تخزين مؤقت LRU محسن مع تتبع نطاق التغيير
- تكييف حجم التخزين المؤقت بناءً على الإطار الزمني
- بحث ثنائي للوصول السريع إلى نطاقات التاريخ
التحكم في عرض القناة
- مضاعف الانحراف المعياري (الافتراضي 2.0)
- نطاقات أوسع لتوسع التقلبات
- نطاقات أضيق للأسواق ذات النطاق المحدود
- متسق عبر جميع أنواع الانحدار
انحدار كثير الحدود
- تحكم في الدرجة: 1-5 (الأعلى = انحناء أكثر)
- يلتقط الاتجاهات غير الخطية
- مفيد للهياكل السعرية المكافئة أو المنحنية
- يرجع إلى الخطي عندما تكون الدرجة = 1
إدارة بصرية نظيفة
- لا حساب على الشريط الجاري التكوين—فقط الأشرطة المكتملة
- اقتطاع متعدد الأطر الزمنية بشكل صحيح—تنتهي الخطوط عند آخر شريط HTF مكتمل
- استقراء قائم على الميل لإسقاط اتجاهي متسق
- سلسلة إخراج واضحة مع أسماء مستويات وصفية
__________________________________________________________________________________________
مزيد من المؤشرات المجانية
استكشف مجموعة واسعة من أدوات تحليل السوق—من الهيكل والحجم إلى الانحدار، التقلب، والأطر الزمنية المخصصة.
رمز المصدر متاح على مستودع GitHub.
جميعها مجانية للاستخدام. ولكن إذا رغبت في دعم القهوة، يمكنك توجيهها هنا.
الدعم/المقاومة
الحجم
- محلل نشاط الحجم
- محلل كفاءة الحجم
- تحليلات ملف الحجم
- ملف الحجم - محدث
- تحليل انتشار الحجم
- VWAP (متوسط السعر المرجح بالحجم)
المتوسطات المتحركة
- قناة SSL
- المتوسط المتحرك المثبت
- المتوسط المتحرك بمقياس الانحراف
- منشط جان العالي والمنخفض
- خط الاتجاه اللحظي
- متوسط متحرك تكيفي كوفمان مع رؤية الاتجاه
- قناة المتوسط المتحرك
- مجموعة المتوسطات المتحركة
- متوسط قناة الاتجاه المتحرك
الأدوات المساعدة/المخصصة
معتمد على الانحدار
التقلب
المذبذبات
__________________________________________________________________________________________
إخلاء المسؤولية
التداول ينطوي على مخاطر. هذا المؤشر مخصص للتحليل الفني فقط — يرجى دائمًا تطبيق إدارة المخاطر المناسبة والتداول بمسؤولية.
التعليقات والتحسينات
إذا كانت لديك اقتراحات، طلبات ميزات، أو أفكار لتحسين، يرجى ترك تعليق في تبويب النقاش. تساعد ملاحظاتك في تحسين المؤشر للجميع.
الملخص
It offers multi-timeframe analysis across 16 periods (from 1 minute to monthly), enabling regression calculations on higher timeframes displayed on the current chart with smooth interpolated rendering. Users can select among three calculation modes: Period-Based (rolling window), Date Range (custom start/end with timezone-aware parsing), and Multi-Timeframe. Channel width is adjustable via a standard deviation multiplier to reflect market volatility.
The indicator features real-time dynamic updates, optimized caching for performance, and extend-to-infinity trendline projections for forward-looking analysis. Visual output is clean, with slope-based extrapolation and no calculations on forming bars. This tool is designed for traders analyzing mean reversion and complex price structures across various market conditions.