
Penerangan
Kira tahap sokongan dan rintangan menggunakan lima kaedah pivot profesional merentasi mana-mana jangka masa.
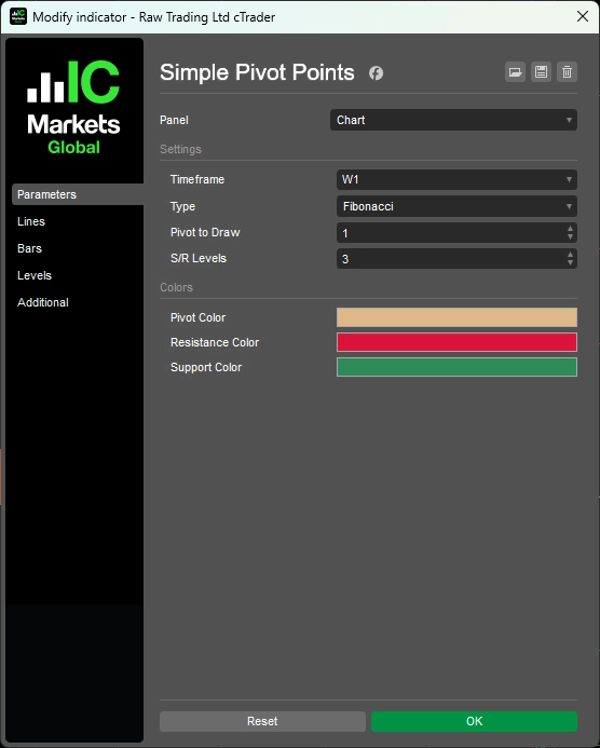
Secara automatik menjana tahap pivot (Standard, Fibonacci, Woodie, Camarilla, DeMark) dari data M5 hingga Bulanan dengan paparan terikat masa untuk setiap tempoh.
Lima algoritma pengiraan dengan logik jarak S/R yang berbeza, tahap sokongan/rintangan yang boleh dikonfigurasi (0-6 setiap sisi), paparan pivot sejarah untuk beberapa tempoh sebelumnya, garis berlabel automatik (PP, R1-R6, S1-S6), dan visualisasi berwarna memberikan analisis pivot tahap institusi untuk pedagang yang mensasarkan tahap harga utama dan pembalikan intrahari.
CIRI-CIRI
Lima Kaedah Pengiraan
- Standard: Formula pedagang lantai klasik—pivot yang paling banyak diperhatikan di seluruh dunia
- Fibonacci: Menggunakan nisbah Fib (38.2%, 61.8%, 100%, 138.2%, 161.8%) untuk jarak S/R
- Woodie: Memberi berat kepada harga penutupan—lebih responsif kepada tindakan harga terkini
- Camarilla: Tahap intrahari ketat menggunakan pengganda 1.1/12—popular untuk scalping
- DeMark: Formula bersyarat berdasarkan hubungan tutup vs. buka—hanya 1 tahap S/R tetapi sangat dihormati
Penyesuaian Penuh
- Mana-mana jangka masa: Kira dari data M5, H1, H4, Harian, Mingguan, Bulanan
- Pivot sejarah: Paparkan sehingga beberapa tempoh sebelumnya (contohnya, 3 minggu terakhir pivot)
- Tahap boleh dikonfigurasi: Paparkan 0-6 tahap sokongan/rintangan setiap sisi
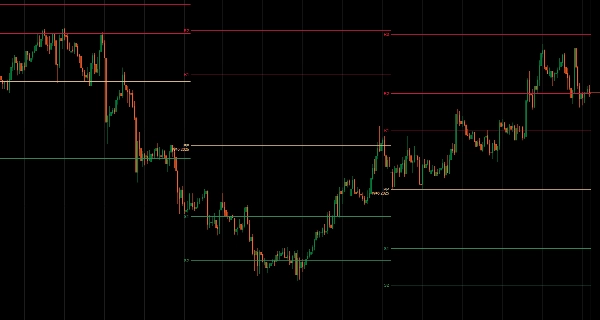
- Garis berlabel automatik: PP, R1-R6, S1-S6 ditandakan dengan jelas
- Garis terikat masa: Pivot setiap tempoh dipaparkan hanya untuk tempoh tersebut
- Berwarna: Pivot (tan), Rintangan (merah), Sokongan (hijau)
__________________________________________________________________________________________
LEBIH BANYAK PENUNJUK PERCUMA
Terokai pelbagai alat analisis pasaran—dari struktur dan volum hingga regresi, volatiliti, dan jangka masa tersuai.
Kod sumber tersedia di repositori GitHub.
Semua percuma untuk digunakan. Tetapi jika anda ingin memberi sokongan kopi, anda boleh salurkan di sini.
Sokongan/Rintangan
Volum
- Profiler Aktiviti Volum
- Penganalisis Kecekapan Volum
- Analitik Profil Volum
- Profil Volum - Dikemas Kini
- Analisis Sebaran Volum
- VWAP (Harga Purata Berwajaran Volum)
Purata Pergerakan
- Saluran SSL
- Purata Pergerakan Berangkai
- Purata Pergerakan Skala Penyimpangan
- Pengaktif Tinggi Rendah Gann
- Garis Tren Segera
- Purata Pergerakan Adaptif Kaufman dengan Visi Tren
- Saluran Purata Pergerakan
- Suite Purata Pergerakan
- Purata Pergerakan Saluran Tren
Utiliti/Tersuai
Berasaskan Regresi
Volatiliti
Pengayun
__________________________________________________________________________________________
PENAFIAN
Perdagangan melibatkan risiko. Penunjuk ini bertujuan untuk analisis teknikal sahaja — sentiasa gunakan pengurusan risiko yang betul dan berdagang dengan bertanggungjawab.
MAKLUMBALAS & PENAMBAHBAIKAN
Jika anda mempunyai cadangan, permintaan ciri, atau idea untuk penambahbaikan, sila tinggalkan komen di tab Perbincangan. Maklumbalas anda membantu memperbaiki penunjuk untuk semua orang.
Ringkasan
Ulasan pelanggan
5 | 100 % | |
4 | 0 % | |
3 | 0 % | |
2 | 0 % | |
1 | 0 % |


