
ADX and ADI
Indikator
258 muat turun
Versi 1.0, Aug 2025
Windows, Mac
5.0
Ulasan: 2
Sejak 21/02/2025
466.3M
Volum yang didagangkan
180.83K
Pip dimenangi
22
Jualan
6.89K
Pemasangan percuma
Penerangan
Ciri Utama:
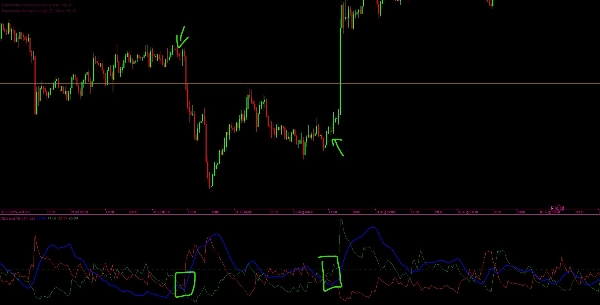
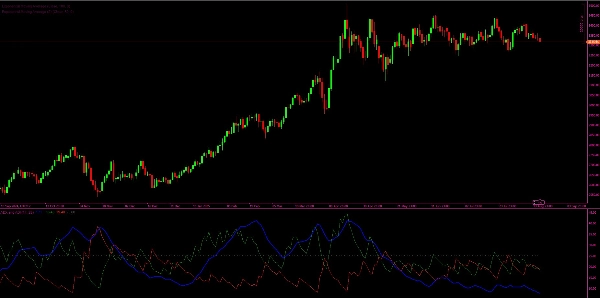
- Garis ADX dan ADI (Biru): Menunjukkan kekuatan yang dilicinkan bagi trend semasa, tanpa mengira arah.
- Garis +DI (Hijau): Menunjukkan kekuatan pergerakan ke atas.
- Garis -DI (Merah): Menunjukkan kekuatan pergerakan ke bawah.
- Garis Ambang (Kelabu): Tahap rujukan mendatar (default 25) untuk membantu mengenal pasti sama ada kekuatan trend adalah signifikan.
Cara Ia Berfungsi:
- Penunjuk mengira Julat Benar (TR), Pergerakan Arah Positif (+DM), dan Pergerakan Arah Negatif (-DM).
- Ia menggunakan teknik pelicinan Wilder untuk mengira nilai yang dilicinkan bagi TR, +DM, dan -DM.
- Daripada ini, Penunjuk Arah (+DI dan -DI) diperoleh, menunjukkan pihak mana (bullish atau bearish) yang mempunyai momentum lebih kuat.
- DX (Indeks Arah) dikira dari perbezaan relatif antara +DI dan -DI.
- Akhirnya, ADX (Indeks Arah Purata) dikira sebagai versi dilicinkan bagi DX, memberikan ukuran kekuatan trend keseluruhan.
Tafsiran:
- Apabila ADX berada di atas ambang (contoh, 25), pasaran dianggap sedang mengalami trend yang kuat.
- Apabila +DI > -DI, pihak bull mengawal (trend menaik).
- Apabila -DI > +DI, pihak bear mengawal (trend menurun).
- Apabila ADX berada di bawah ambang, pasaran dianggap sedang dalam julat (trend lemah atau tiada trend).
Ringkasan
Ringkasan AI
This custom indicator provides a full implementation of the Average Directional Index (ADX) and Directional Indicators (DI) to measure trend strength and direction in financial markets. It displays four key lines: the ADX and ADI line (blue) representing smoothed trend strength regardless of direction; the +DI line (green) indicating upward movement strength; the -DI line (red) indicating downward movement strength; and a threshold line (gray, default 25) to identify significant trend strength.
The indicator calculates True Range (TR), Positive Directional Movement (+DM), and Negative Directional Movement (-DM), applying Wilder’s smoothing technique to derive smoothed values. From these, it computes the +DI and -DI lines to show bullish or bearish momentum. The Directional Index (DX) is calculated from the relative difference between +DI and -DI, and the ADX is a smoothed version of DX, quantifying overall trend strength.
Interpretation guidelines include: ADX above the threshold signals a strong trend; +DI greater than -DI indicates bullish control; -DI greater than +DI indicates bearish control; and ADX below the threshold suggests a ranging or weak trend market.
Profil indikator
Ulasan pelanggan
5.0
Ulasan: 2
5 | 100 % | |
4 | 0 % | |
3 | 0 % | |
2 | 0 % | |
1 | 0 % |
Ulasan pelanggan
December 1, 2025
ADX and ADI delivers clean trend strength and direction signals. ADX shows when the market is actually trending, while +DI and -DI reveal who’s in control. Stable, lightweight and reliable across all timeframes. Best on H1+ for smoother signals. Alerts and zone-highlighting would be great additions.
September 12, 2025
Perbincangan
Soalan Lazim
Produk yang tersedia melalui cTrader Store, termasuk bot dagangan, indikator dan plugin, disediakan oleh pembangun pihak ketiga dan diberikan akses untuk tujuan maklumat dan teknikal sahaja. cTrader Store bukan broker dan tidak memberikan nasihat pelaburan, syor peribadi atau sebarang jaminan prestasi masa hadapan.


![Logo "[Stellar Strategies] BOS Trend 1.0"](https://cdn.ctrader.com/image/webp/6cdec0f1-0e97-4a82-a8a4-2b67aed54d38_25695)


![Logo "Gaussian Channel [Iridio Capital]"](https://cdn.ctrader.com/image/webp/7c039209-5573-4a54-a072-f9528b503103_41960)


Harga
Sejak 21/02/2025
466.3M
Volum yang didagangkan
180.83K
Pip dimenangi
22
Jualan
6.89K
Pemasangan percuma